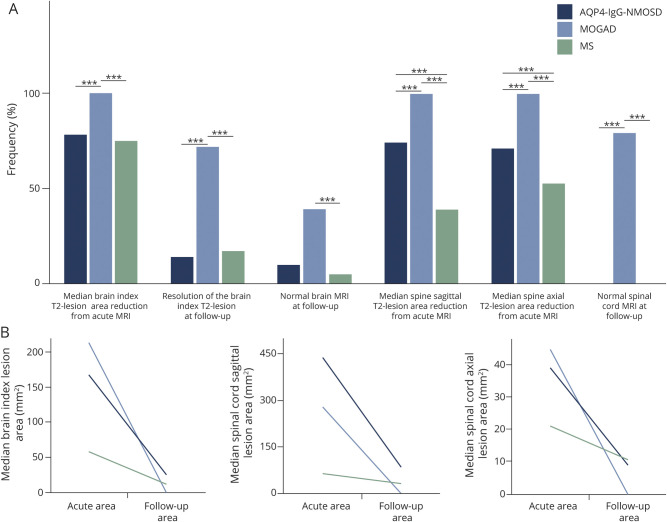
Figure 4. Graphical Comparison of MRI Evolution of T2 Lesions in the 3 Disease Groups.
(A) Bar graphs show the different frequency of the analyzed measures in patients with aquaporin 4–immunoglobulin G–positive neuromyelitis optica spectrum disorder (AQP4-IgG-NMOSD) (dark blue bars), myelin oligodendrocyte glycoprotein–immunoglobulin G–associated disorder (MOGAD) (light blue bars), and multiple sclerosis (MS) (green bars) in the brain and spinal cord. Although the largest reduction in size was observed in AQP4-IgG-NMOSD and MOGAD associated lesions, only the latter show complete resolution of MRI abnormalities at follow-up in the majority of cases. On the contrary, MS lesions showed the smallest reduction in size at follow-up and, similarly to AQP4-IgG-NMOSD lesions, were unlikely to resolve completely. Statistically significant differences between 2 groups are indicated by the asterisks on top of the bars (***). (B) The median largest area for brain and spinal cord lesions axially, and sagittally for the spinal cord only, acutely and at follow-up MRI for the 3 groups. The exact p values for different comparisons are shown in tables 2 and 3.

