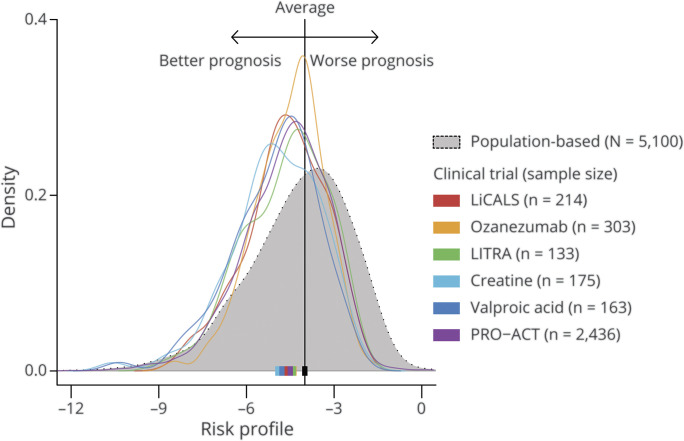
Figure 1. Distribution of Risk Profiles in Clinical Trial and Population-Based Cohorts.
For each patient, we calculated his or her risk profile (horizontal axis), a composite score of 7 prognostic variables, which ranges from approximately −12 (very long prognosis) to 0 (very short prognosis). The distribution of the risk profiles is given as density curves, with the probability density on the vertical axis. The interpretation of the figure is similar to that of a histogram. The colors represent different trial populations; the population-based cohort is in gray. The solid squares are the population medians. A clear shift is observed in trial populations towards a better prognosis compared to a population-based cohort, which reflects the underrepresentation of patients with a poor prognosis in clinical trials. Exact ranges per cohort are available from Dryad (eAppendix 1, doi.org/10.5061/dryad.fbg79cnv7); LiCALS = lithium carbonate in patients with amyotrophic lateral sclerosis; PRO-ACT = Pooled Resource Open-Access ALS Clinical Trials.

