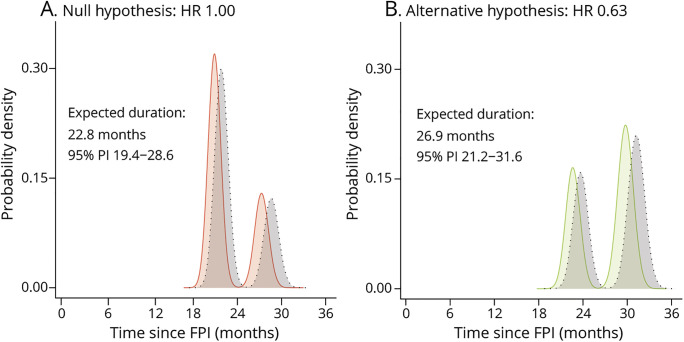
Figure 2. Expected Trial Duration Under the Null and Alternative Hypothesis.
Distribution of simulated trial duration under the null hypothesis (H0, i.e., hazard ratio [HR] 1, panel A) and alternative hypothesis (H1, i.e., HR 0.63, panel B). The vertical axis reflects the probability density; its interpretation is similar to a histogram. Due to the lack of a treatment benefit under H0, the required number of events occurs more rapidly and the average duration is shorter compared to H1. The peaks reflect the average analysis time points; the last peak in panel B is centered around 30 months (i.e., when all assumptions hold). In gray is a scenario when the survival probability in the placebo arm is better than expected (60.0% instead of 56.1%). FPI = first patient first visit; PI = percentile interval of the empirical trial duration ranging from the 2.5th to the 97.5th percentile.

