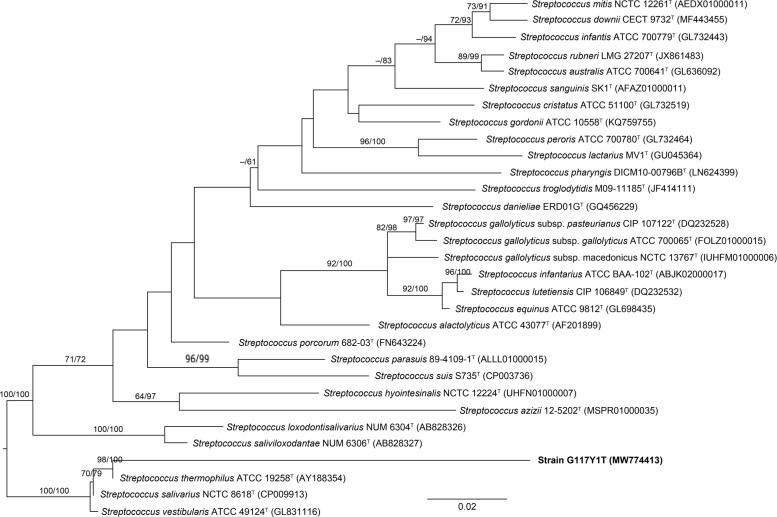
Fig. 3.
The phylogenetic tree constructed by the maximum likelihood method and rooted by midpoint-rooting. Branches are scaled in terms of the expected number of nucleotide substitutions per site. Numbers at nodes indicate the bootstrap support values larger than 60% from maximum likelihood (left) and maximum parsimony (right) bootstrapping. GenBank accession numbers are given in brackets.

