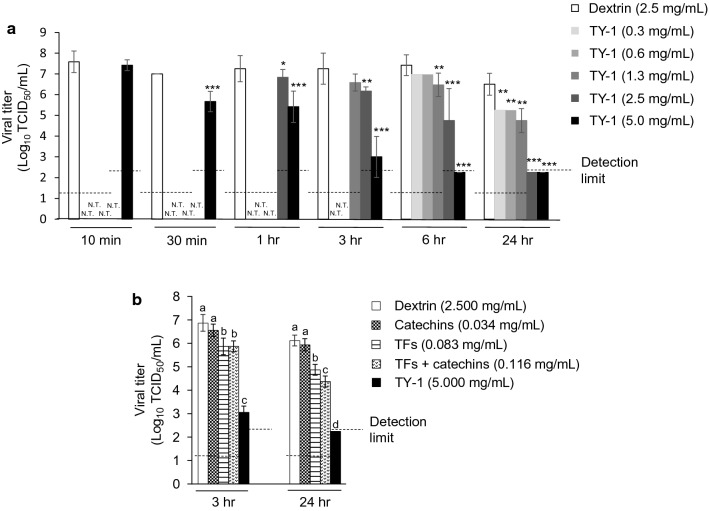
Fig. 1.
Evaluation of the virucidal activity of TY-1 at different concentrations and exposure periods. a, b Dextrin (2.5 mg/mL) was used as a solvent control. The results are indicated as the mean ± SD (n > 4 per group). a Student’s t-test was performed to analyze statistical differences between the dextrin group and each TY-1 group: *p < 0.05, **p < 0.001, ***p < 0.001. N.T.: not tested. b One-way analysis of variance (ANOVA) followed by Tukey’s post hoc test were performed to analyze statistical differences among all test solution groups; test solution groups that do not share a common letter were significantly different (*p < 0.05)

