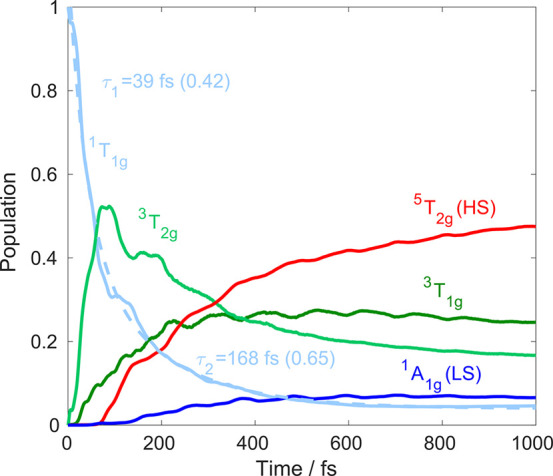
Figure 5.

Simulated population dynamics upon excitation into the 1T1g manifold. The 1T1g population curve (light blue) is fitted with a biexponential functional (dashed line); the numbers in parentheses denote the coefficients of the two exponential components.
