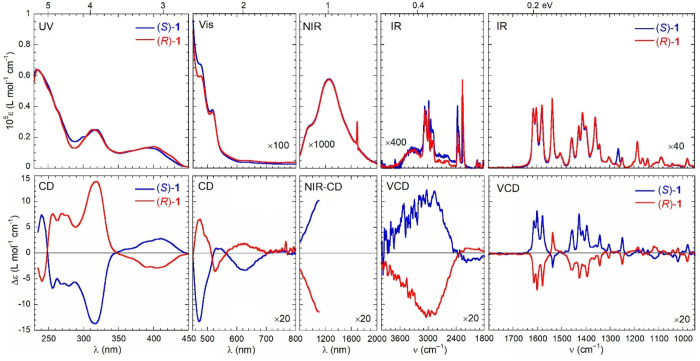
Figure 3.
Optical (top) and chiroptical (bottom) superspectra of (R)-1 (red curves) and (S)-1 (blue curves). Measurement conditions: UV region, 0.27 mM in CHCl3, 0.1 cm cell; visible region, 0.27 mM in CHCl3, 1 cm cell; NIR region, 0.88 mM in CHCl3, 2 cm cell; VCD region, 4000–2000 cm–1 subrange, 0.11 M [(R)-1] and 0.12 M [(S)-1] in CDCl3, 200 μm cell; VCD region, 2000–900 cm–1 subrange, 40 mM in CDCl3, 200 μm cell. See Materials and Methods for further details.

