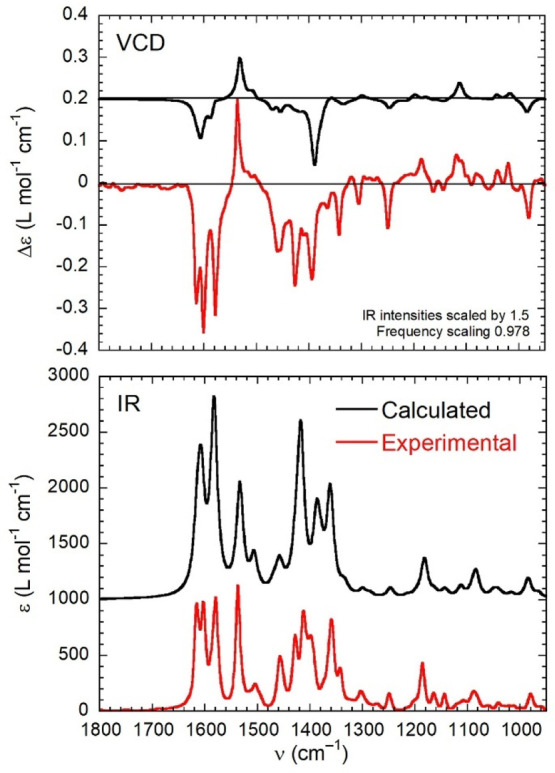
Figure 7.

Comparison between the experimental (red lines) and calculated (black lines) VCD (top) and IR (bottom) spectra of (R)-1. Calculations run at the B3LYP/def2-TZVP level with PCM for chloroform on the C2-symmetric structure of Λ-(R)-1. The parameters used to generate the calculated spectra are given in the inset.
