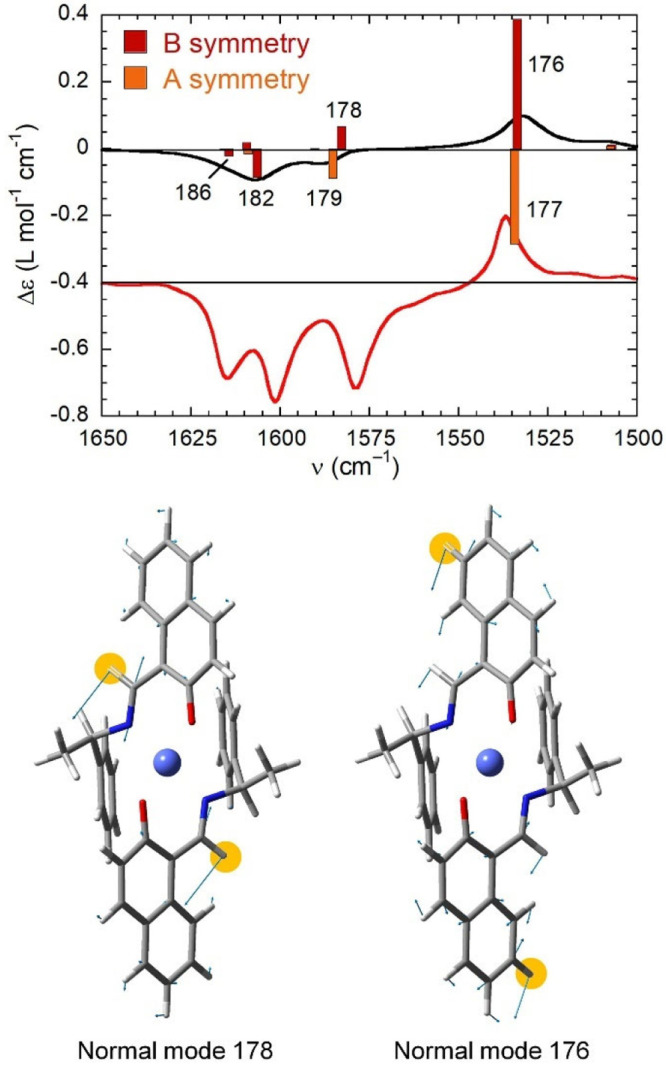
Figure 8.

Top: Calculated VCD spectrum (black line) in the 1500–1650 cm–1 range for the C2-symmetric structure of (R)-1 with band assignment, compared with the experimental spectrum (red line). The plotted parameters are the same as those in Figure 7. Bottom: Atom displacements (light-blue arrows) for B-symmetry normal modes 176 and 178. The H atoms contributing most to the normal modes are highlighted.
