Figure 1.
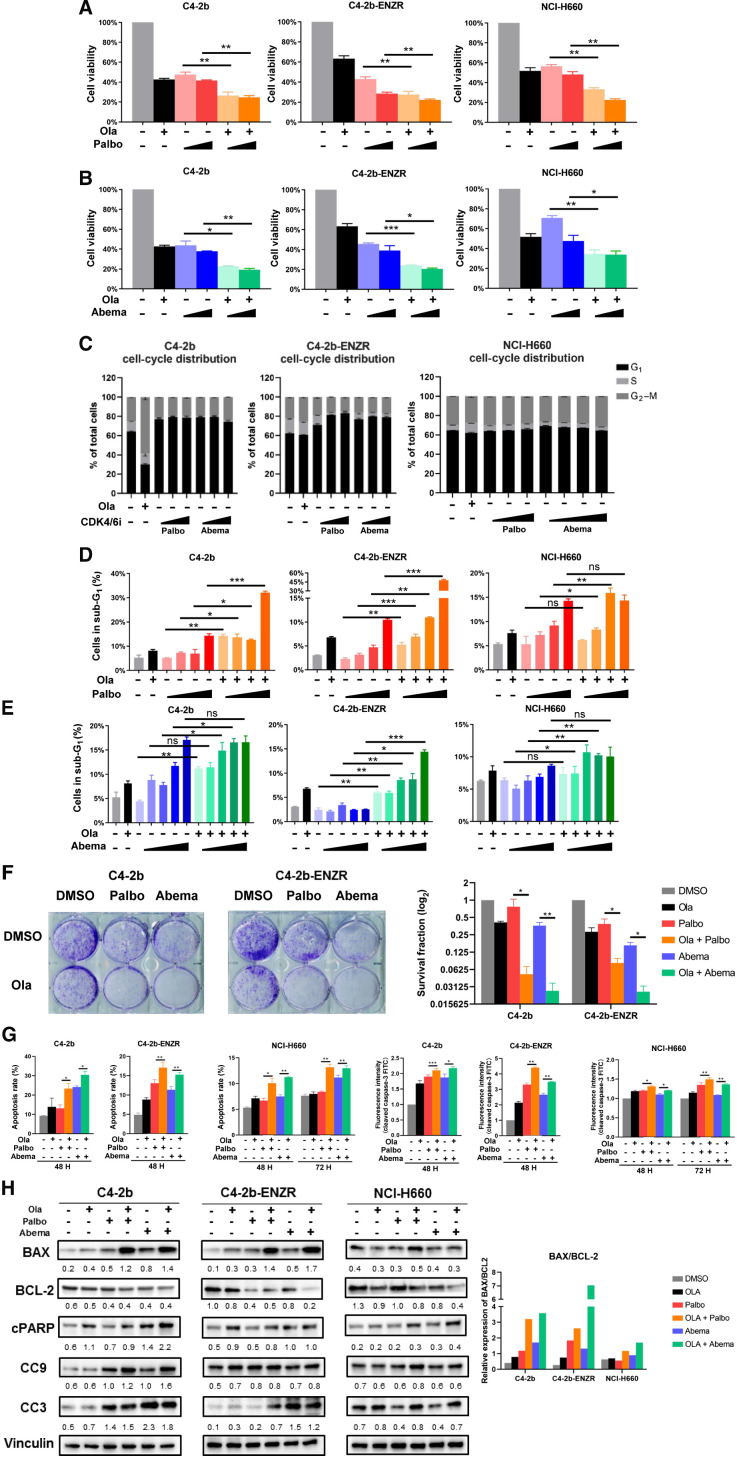
PARP inhibitor and CDK4/6 inhibitor combination treatment suppresses cell proliferation and induces apoptosis of prostate cancer cells in vitro. A and B, MTS cell viability assays showing effect of olaparib (Ola), palbociclib (Palbo), abemaciclib (Abema), and olaparib + palbociclib (Ola + Palbo) or olaparib + abemaciclib (Ola + Abema) combination treatment on viable proliferation of C4–2b, C4–2b-ENZR, and NCI-H660 prostate cancer cells. C4–2b and C4–2b-ENZR: olaparib, 2 μmol/L; palbociclib, 100 nmol/L and 1 μmol/L; abemaciclib, 1 nmol/L and 10 nmol/L. NCI-H660: olaparib, 10 μmol/L; palbociclib, 100 nmol/L and 1 μmol/L; abemaciclib, 1 nmol/L and 10 nmol/L. C, Flow cytometry showing effect of olaparib, palbociclib, and abemaciclib treatment on cell cycle distribution in C4–2b, C4–2b-ENZR, and NCI-H660 prostate cancer cells. Cells were treated as shown in A and B. D and E, Flow cytometry showing sub-G1 (apoptotic) prostate cancer cells treated by olaparib, palbociclib, abemaciclib, and combination of olaparib + palbociclib or olaparib + abemaciclib. C4–2b and C4–2b-ENZR: olaparib, 2 μmol/L; palbociclib, 10 nmol/L, 100 nmol/L, 1 μmol/L, 10 μmol/L; abemaciclib, 0.1 nmol/L, 1 nmol/L, 10 nmol/L, 100 nmol/L, 1 μmol/L. NCI-H660: olaparib, 10 μmol/L; palbociclib, 10 nmol/L, 100 nmol/L, 1 μmol/L, 10 μmol/L; abemaciclib, 0.1 nmol/L, 1 nmol/L, 10 nmol/L, 100 nmol/L, 1 μmol/L. Data are plotted as the percentage of cells in sub-G1. F, Colony-formation assay of C4–2b and C4–2b-ENZR prostate cancer cells treated with olaparib, palbociclib, abemaciclib, and the combination of olaparib + palbociclib or olaparib + abemaciclib. The results were observed after 14 days of treatment. C4–2b and C4–2b-ENZR: olaparib, 500 nmol/L; palbociclib, 100 nmol/L; abemaciclib, 10 nmol/L. The histogram in the right panel shows mean ± SEM of (clone) counts from at least three assay replicates. G, Quantification analysis of apoptosis and fluorescence intensity of cleaved caspase-3-FITC in PARPi (olaparib), CDK4/6i (palbociclib or abemaciclib), or PARPi+CDK4/6i combination treatment of prostate cancer cells. C4–2b and C4–2b-ENZR: olaparib, 2 μmol/L; palbociclib, 2 μmol/L; abemaciclib, 2 μmol/L; NCI-H660: olaparib, 10 μmol/L; palbociclib, 10 μmol/L; abemaciclib, 10 μmol/L, incubated for 48 and 72 hours, respectively. The data are shown as mean ± SEM of three assay replicates. H, Immunoblots to show the proapoptotic response of prostate cancers treated with combination PARPi and CDK4/6i after 48 hours of incubation. C4–2b and C4–2b-ENZR: olaparib, 2 μmol/L; palbociclib, 2 μmol/L; abemaciclib, 2 μmol/L. NCI-H660: olaparib, 10 μmol/L; palbociclib, 10 μmol/L; abemaciclib, 10 μmol/L. IB signals in respective prostate cancer cells were scanned, quantified, and plotted to show BAX/BCL-2 ratios for the indicated treatments. Densitometric scans of IB bands were quantified and analyzed by ImageJ as previously reported (12), and the relative band intensities expressed as the folds of vinculin (internal IB reference), and indicated below each protein specific IB band image in the figure. For A, B, D, E, F, and G,t tests were used to determine statistical significance of the differences as indicated: ns, not significant; *, P < 0.05; **, P < 0.01; ***, P < 0.001.

