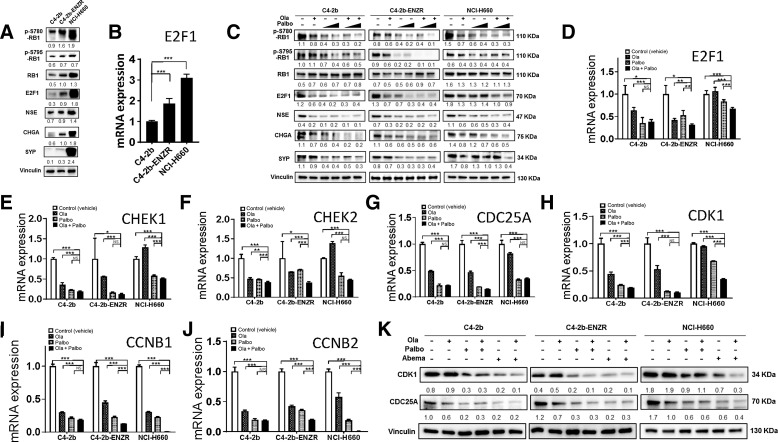
Figure 2.
PARP inhibitor and CDK4/6 inhibitor combination treatment inhibits E2F1 signaling in prostate cancer through transcriptional and posttranslational regulation in prostate cancer cells. A, Basal expression levels of RB, pRB-Ser780/795, E2F1 proteins, and E2F1 targets including NED markers NSE, CHGA, and SYP in C4–2b, C4–2b-ENZR, and NCI-H660 prostate cancer cells. B,E2F1 mRNA expression in C4–2b, C4–2b-ENZR, and NCI-H660 prostate cancer cells. C, Effects of PARPi (olaparib), CDK4/6i (palbociclib), and combination olaparib + palbociclib on RB, pRB-Ser780/795, E2F1, and E2F1 signaling targets (NED markers) in C4–2b, C4–2b-ENZR, and NCI-H660 prostate cancer cells. C4–2b and C4–2b-ENZR: olaparib, 2 μmol/L; palbociclib, 100 nmol/L and 1 μmol/L. NCI-H660: olaparib, 10 μmol/L; palbociclib, 100 nmol/L and 1 μmol/L. All treatments involved a 48-hour incubation. D–J, qRT-PCR analysis to determine E2F1 and E2F1 target mRNA expression in C4–2b, C4–2b-ENZR, and NCI-H660 prostate cancer cells treated with PARPi (olaparib), CDK4/6i (palbociclib), or olaparib + palbociclib combination. K, Immunoblot to show suppression of CDK1 and CDC25 protein expression by PARPi (olaparib), CDK4/6i (palbociclib or abemaciclib), and olaparib + palbociclib or olaparib + abemaciclib combination treatment in prostate cancer cells. Immunoblot signals (A, C, K) were quantified and normalized to vinculin, and the relative band intensities shown below each protein specific IB band image in the figure. For B, D, E, F, G, H, I and J, t tests were used to determine statistical significance of the differences as indicated: ns, not significant; *, P < 0.05; **, P < 0.01; ***, P < 0.001.

