. 2021 Jun 22;20(9):1680–1691. doi: 10.1158/1535-7163.MCT-20-0848

Figure 3.

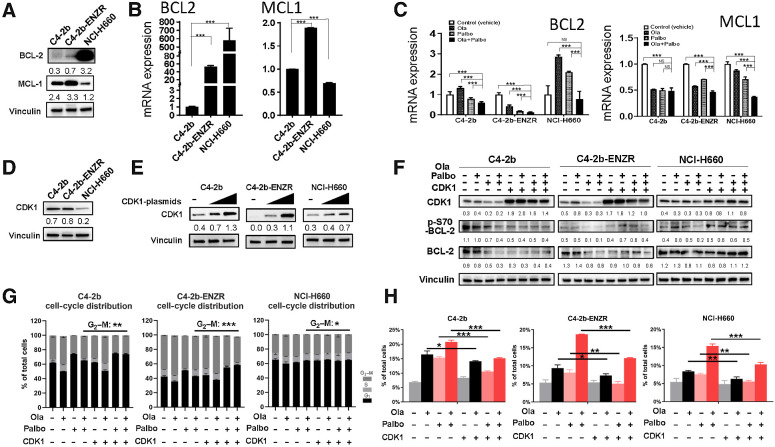
Figure 3. CDK1 overexpression upregulates “prosurvival sensor” p-S70-BCL-2 and rescues prostate cancer cells from PARPi+CDK4/6i combination treatment–induced apoptosis. A, Immunoblots showing expression of anti-proapoptotic BCL-2 and MCL-1 proteins in C4–2b, C4–2b-ENZR, and NCI-H660 prostate cancer cells, which is consistent with BCL-2 and MCL-1 mRNA expression determined by RT-qPCR and shown in B. C, qRT-PCR results show expression of BCL-2 and MCL-1 mRNAs regulated by PARPi (olaparib), CDK4/6i (palbociclib), and olaparib + palbociclib combination treatment in prostate cancer cells. D, Immunoblots showing the CDK1 protein basal expression levels in prostate cancer cell line models. E, Overexpression of exogenous CDK1 protein by transfecting CDK1 expression vectors in C4–2b, C4–2b-ENZR, and NCI-H660 prostate cancer cells. F, Immunoblots showing p-S70-BCL-2 and BCL-2 protein expression in prostate cancer cells treated with olaparib, palbociclib, and olaparib + palbociclib in C4–2b, C4–2b-ENZR, and NCI-H660, with or without CDK1 overexpression by transfection of CDK1 expression vector after 48 hours of treatment. C4–2b and C4–2b-ENZR: olaparib, 2 μmol/L; palbociclib, 2 μmol/L; or combinations. NCI-H660: olaparib, 10 μmol/L; palbociclib, 10 μmol/L; or combinations. Immunoblot signals (A, D, E, F) were quantified and normalized to vinculin, and the relative band intensities shown below each protein specific IB band image in the figure. G, Flow cytometry showing effect of olaparib, palbociclib, combination olaparib + palbociclib, and overexpression of CDK1 on cell-cycle distribution in C4–2b, C4–2b-ENZR, and NCI-H660 cells. C4–2b and C4–2b-ENZR: olaparib, 2 μmol/L; palbociclib, 2 μmol/L. NCI-H660: olaparib, 10 μmol/L; palbociclib, 10 μmol/L. H, Flow cytometry showing sub-G1 (apoptotic) cell distribution with olaparib, palbociclib, or combination olaparib + palbociclib, with or without overexpression of CDK1 in C4–2b, C4–2b-ENZR, and NCI-H660 cells. For B, C, and H, t tests were used to determine statistical significance of the differences as indicated: ns, not significant; *, P < 0.05; **, P < 0.01; ***, P < 0.001.

CDK1 overexpression upregulates “prosurvival sensor” p-S70-BCL-2 and rescues prostate cancer cells from PARPi+CDK4/6i combination treatment–induced apoptosis. A, Immunoblots showing expression of anti-proapoptotic BCL-2 and MCL-1 proteins in C4–2b, C4–2b-ENZR, and NCI-H660 prostate cancer cells, which is consistent with BCL-2 and MCL-1 mRNA expression determined by RT-qPCR and shown in B. C, qRT-PCR results show expression of BCL-2 and MCL-1 mRNAs regulated by PARPi (olaparib), CDK4/6i (palbociclib), and olaparib + palbociclib combination treatment in prostate cancer cells. D, Immunoblots showing the CDK1 protein basal expression levels in prostate cancer cell line models. E, Overexpression of exogenous CDK1 protein by transfecting CDK1 expression vectors in C4–2b, C4–2b-ENZR, and NCI-H660 prostate cancer cells. F, Immunoblots showing p-S70-BCL-2 and BCL-2 protein expression in prostate cancer cells treated with olaparib, palbociclib, and olaparib + palbociclib in C4–2b, C4–2b-ENZR, and NCI-H660, with or without CDK1 overexpression by transfection of CDK1 expression vector after 48 hours of treatment. C4–2b and C4–2b-ENZR: olaparib, 2 μmol/L; palbociclib, 2 μmol/L; or combinations. NCI-H660: olaparib, 10 μmol/L; palbociclib, 10 μmol/L; or combinations. Immunoblot signals (A, D, E, F) were quantified and normalized to vinculin, and the relative band intensities shown below each protein specific IB band image in the figure. G, Flow cytometry showing effect of olaparib, palbociclib, combination olaparib + palbociclib, and overexpression of CDK1 on cell-cycle distribution in C4–2b, C4–2b-ENZR, and NCI-H660 cells. C4–2b and C4–2b-ENZR: olaparib, 2 μmol/L; palbociclib, 2 μmol/L. NCI-H660: olaparib, 10 μmol/L; palbociclib, 10 μmol/L. H, Flow cytometry showing sub-G1 (apoptotic) cell distribution with olaparib, palbociclib, or combination olaparib + palbociclib, with or without overexpression of CDK1 in C4–2b, C4–2b-ENZR, and NCI-H660 cells. For B, C, and H, t tests were used to determine statistical significance of the differences as indicated: ns, not significant; *, P < 0.05; **, P < 0.01; ***, P < 0.001.