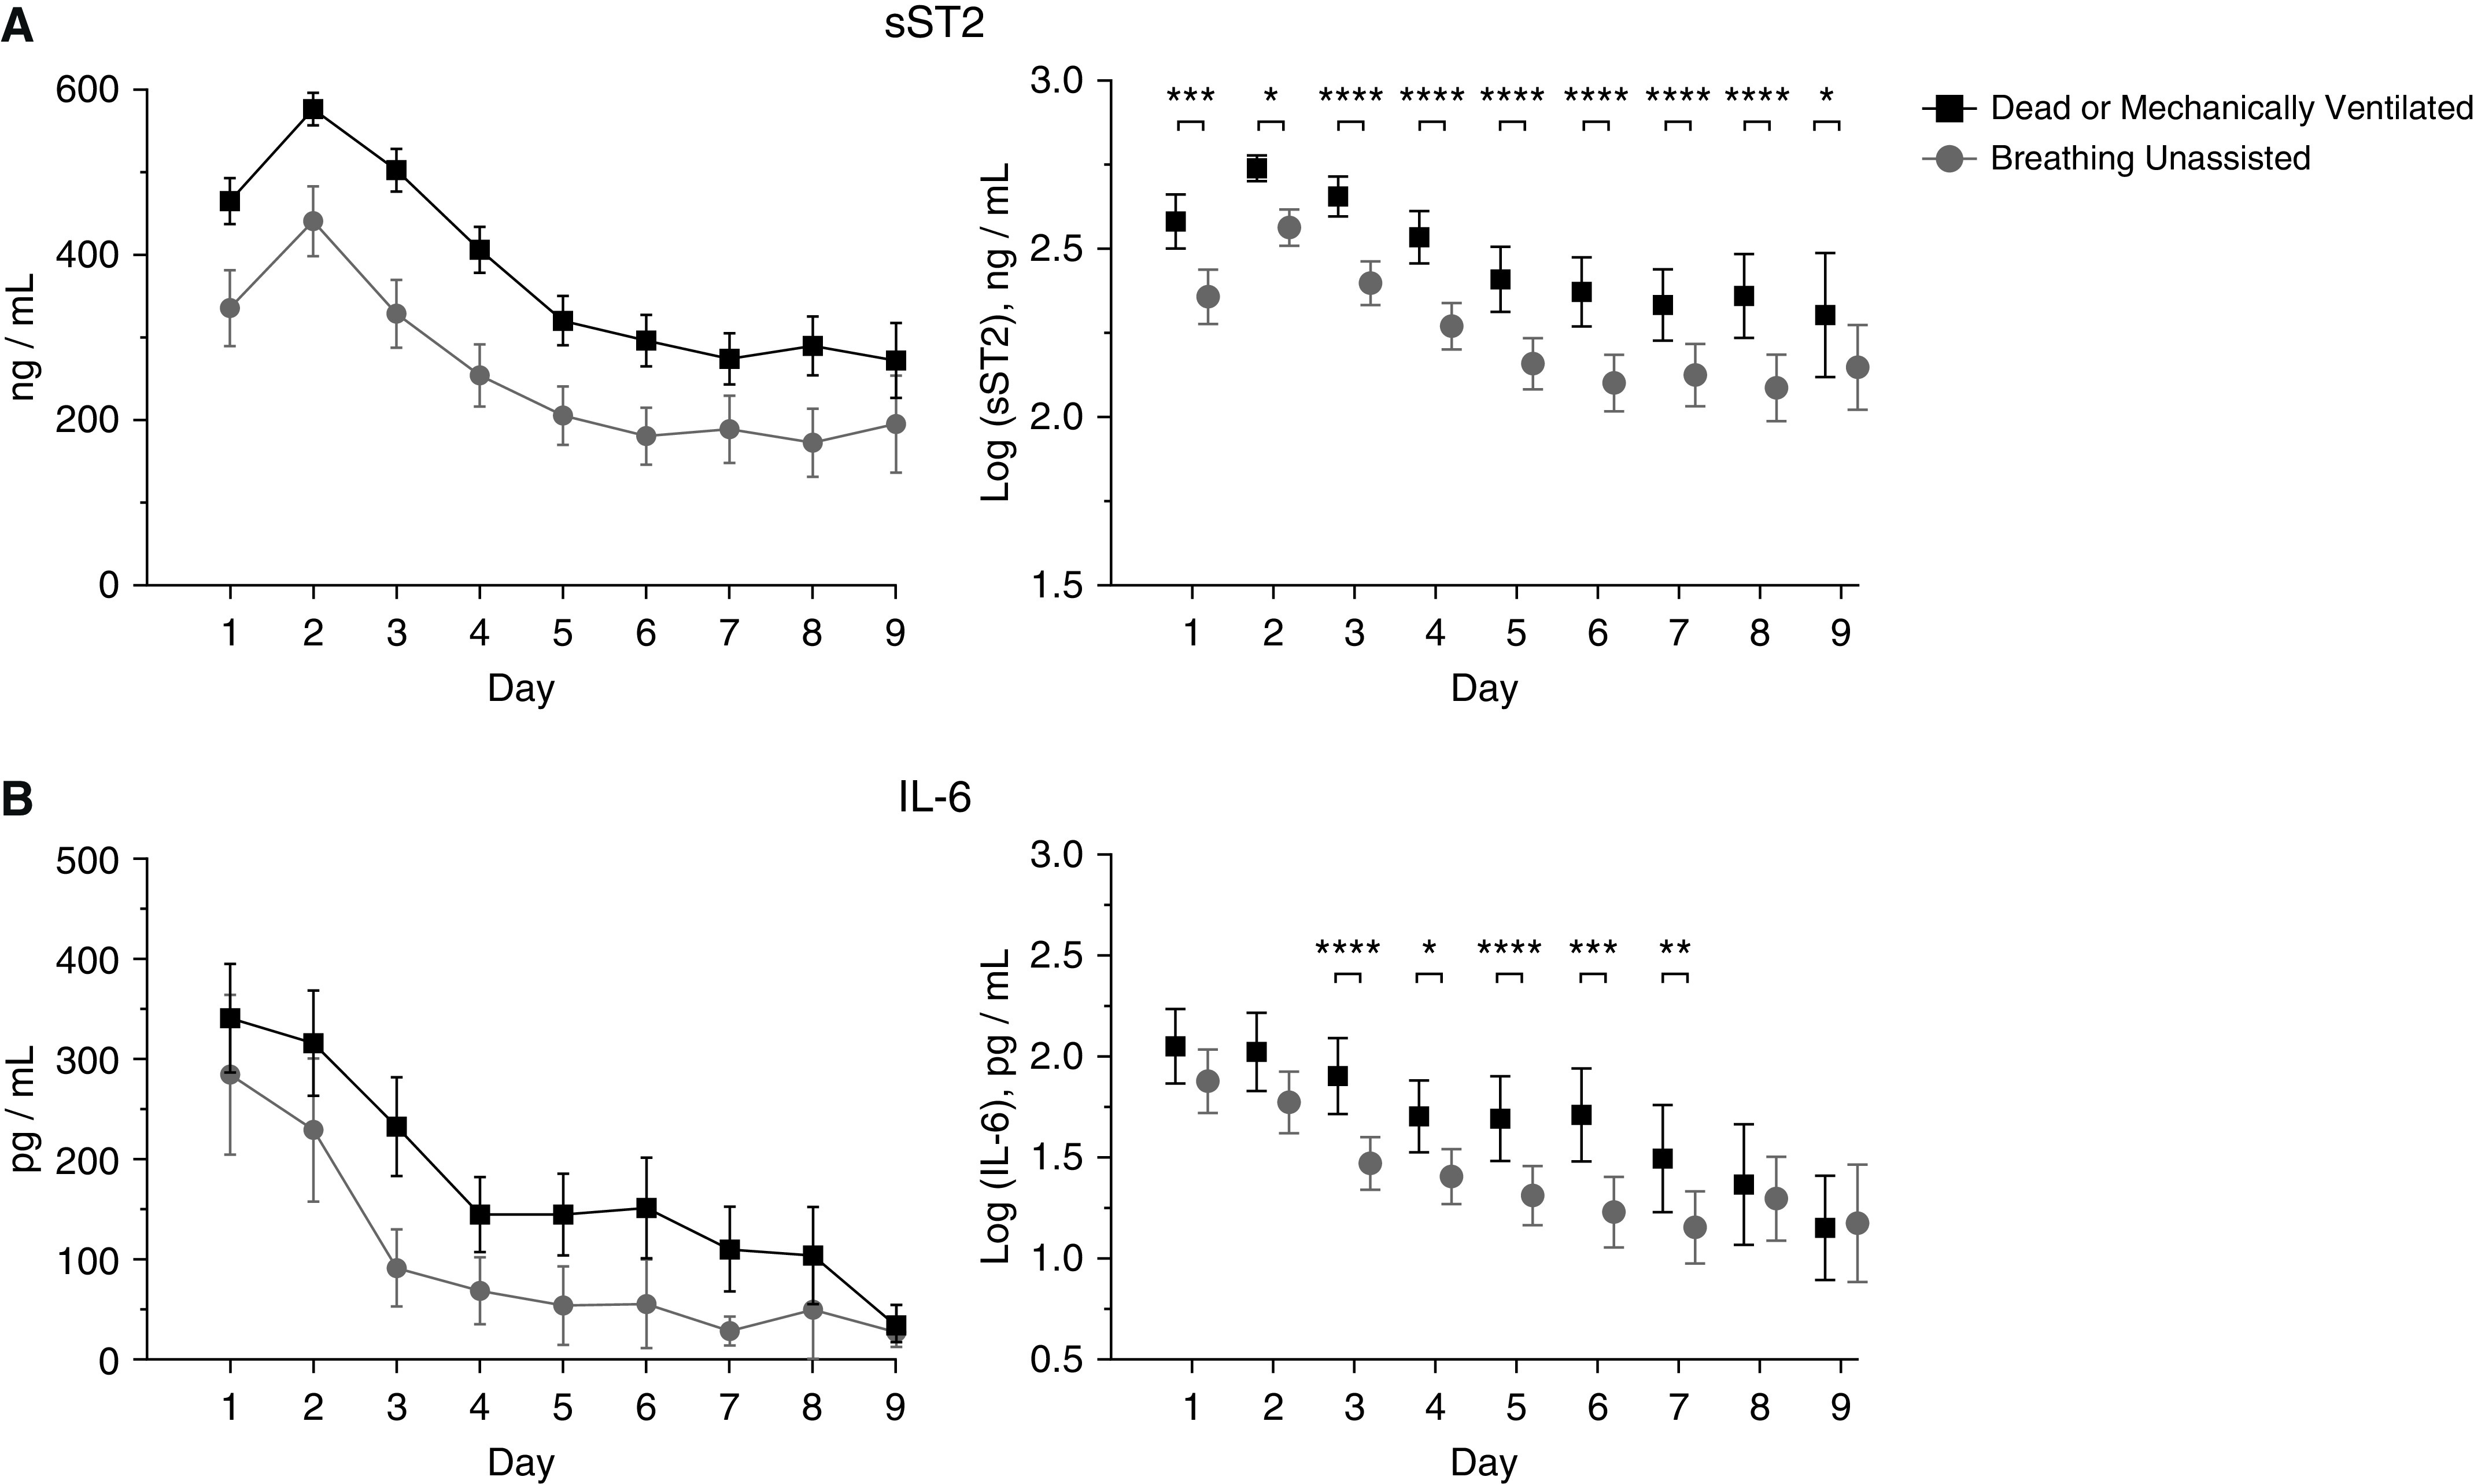
Figure 2.

Biomarker trends by day and association with the primary outcome. (A) sST2 (soluble suppression of tumorigenicity-2) and IL-6 concentrations by day in patients dead or mechanically ventilated versus those breathing unassisted by Day 29. Data shown are mean and 95% confidence interval (CI). (B) Comparison of log-transformed sST2 and IL-6 concentrations by day in patients dead or mechanically ventilated versus those breathing unassisted by Day 29. Data shown are mean and 95% CI. Mixed-model ANOVA with Sidak’s test for multiple comparisons was used to assess the statistical significance of differences between groups. *P < 0.05, **P < 0.01, ***P < 0.001, and ****P < 0.0001.
