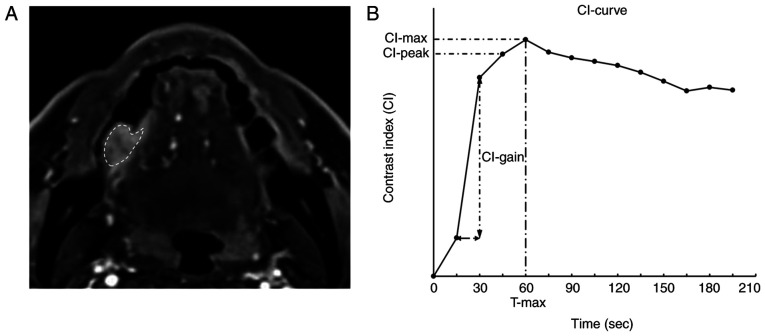
Figure 1.
DCE-MRI image and typical CI curve of OSCC. (A) Region of interest was drawn on the DCE-MRI image to include the region containing the greatest diameter of the tumor. (B) CI curve was constructed using DCE-MRI and CI curve parameters. DCE-MRI, dynamic contrast-enhanced magnetic resonance imaging; CI, contrast index.

