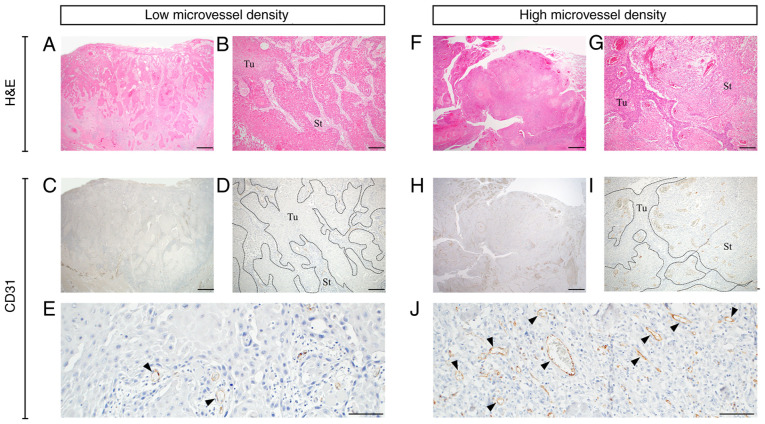
Figure 2.
Microvessel density in OSCC. (A-E) Representative OSCC case with low microvessel density. (F-J) Representative OSCC case with high microvessel density. (A, B, F and G) H&E staining. (C, D, E, H, I and J) Immunohistochemistry staining for CD31. The slides were examined at low and high magnifications. Borders between Tu and St are shown using the dotted lines. Arrowheads indicate CD31-positive microvessels. Scale bar=1 mm in A, C, F and H. Scale bar=200 µm in B, D, G and I. Scale bar=100 µm in E and J. OSCC, oral squamous cell carcinoma; Tu, tumor; St, stroma; H&E, hematoxylin and eosin.

