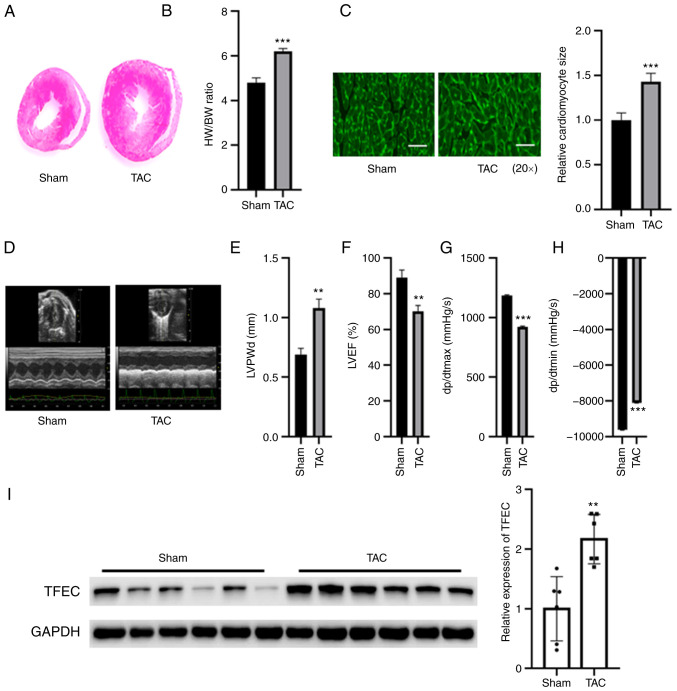
Figure 1.
TFEC expression is increased in the hypertrophic myocardia of mice subjected to TAC. (A) Hematoxylin and eosin staining of heart tissues. (B) HW/BW was evaluated in the sham and TAC groups. (C) Wheat germ agglutinin staining showed that the cardiomyocyte size was significantly increased in the hypertrophic myocardia of mice subjected to TAC compared with control mice (magnification, x20). (D) Representative echocardiographic images. (E) LVPWd, (F) LVEF (%), (G) dp/dtmax and (H) dp/dtmin were quantified in the hearts of TAC and sham control groups. (I) Western blotting showed that TFEC expression was increased in the hypertrophic myocardia of mice subjected to TAC compared with control mice. **P<0.01 and ***P<0.001. TAC, transverse aortic constriction; TFEC, transcription factor EC; HW/BW, heart weight and body weight ratio; LVEF, left ventricular ejection fractions; LVPWd, left ventricular posterior wall diameter; dp/dtmax, maximum change in left ventricular pressure over time; dp/dtmin, minimum change in left ventricular pressure over time.

