Figure 6.
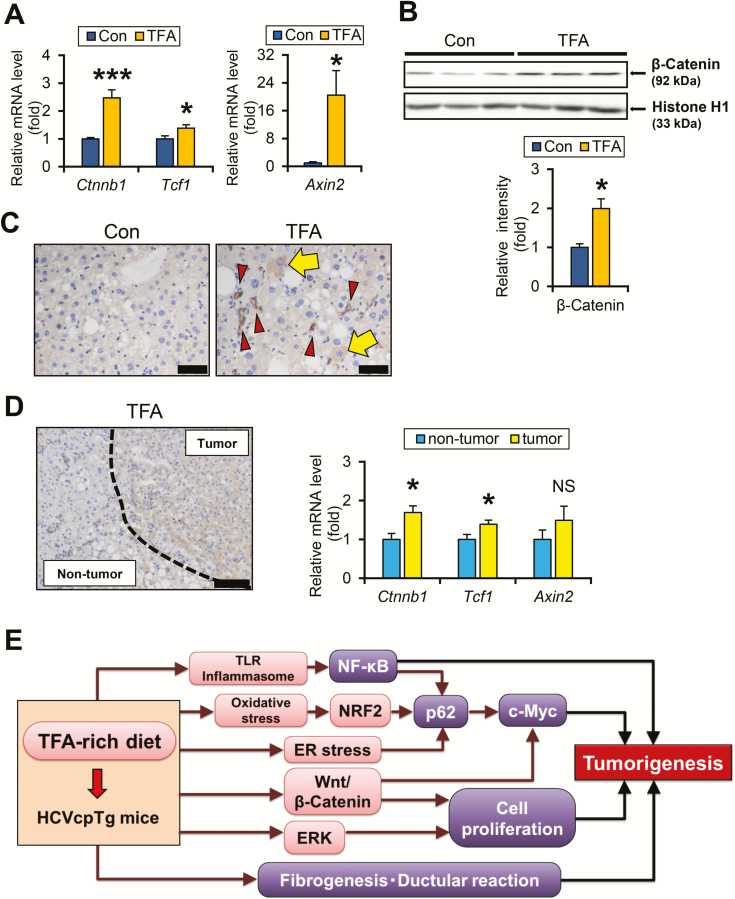
TFA-rich diet activates Wnt/β-catenin signaling in HCVcpTg mice. (A) Hepatic mRNA levels of genes associated with Wnt/β-catenin signaling were quantified by qPCR, normalized to those of 18S ribosomal RNA and expressed as values relative to HCVcpTg mice fed a control diet. (B) Nuclear β-catenin levels. Liver nuclear fractions (45 μg of protein) were loaded into each well and the band of histone H1 was used as the respective loading control. Band intensities were measured densitometrically, normalized to those of histone H1 and expressed as values relative to HCVcpTg mice treated with a control diet. Results were obtained from two independent immunoblot experiments and representative blots were shown. (C) Immunohistochemical staining for β-catenin. In control HCVcpTg mice, β-catenin was weakly positive for cholangiocytes. In TFA-rich diet-fed mice, β-catenin was positively stained in some hepatocytes (arrows), as well as proliferating bile ducts (arrowheads). Bar = 40 μm. (D, left) Immunohistochemical staining for β-catenin in liver tumor of TFA-rich diet-fed HCVcpTg mice. β-catenin was intensely stained in tumor cells compared with the surrounding non-tumorous hepatocytes. Bar = 100 μm. (D, right) Comparison of β-catenin and its downstream signaling between tumorous and non-tumorous tissues in TFA-rich diet-fed HCVcpTg mice. The mRNA levels were quantified by qPCR, normalized to those of 18S ribosomal RNA and expressed as values relative to non-tumorous tissue of TFA-rich diet-fed HCVcpTg mice. Data are expressed as mean ± SEM. *P < 0.05 and ***P < 0.001 between control diet-fed and TFA-rich diet-fed HCVcpTg mice. Con, control diet-fed HCVcpTg mice; TFA, TFA-rich diet-fed HCVcpTg mice; NS, not significant. (E) A proposed mechanism on how a TFA-rich diet promotes liver tumorigenesis in HCVcpTg mice.

