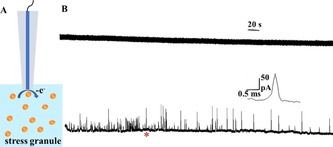
Figure 1.

A) Schematic of electrochemical measurement of stress granules (SGs) isolated from NaAsO2‐treated U2OS cells (schematic of SGs structure is shown in Figure S1). B) Representative amperometric traces of SGs obtained from a 33 μm CFME (upper trace) and a 25 μm Pt electrode at 400 mV vs. Ag/AgCl (lower trace). The inset shows an amplification of the spike labeled with the red asterisk.
