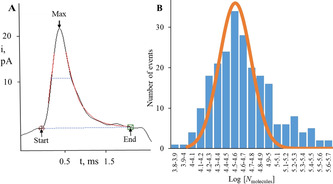
Figure 3.

A) A typical spike analysis for quantification of release kinetics of H2O2 from single SGs and the number of H2O2 molecules. B) Distribution of log [N molecules]. Fits were obtained from a Gaussian distribution of the data (collected from four isolations of SGs; number of events, 229).
