
Figure 4.
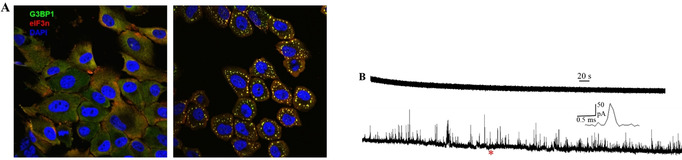
A) Representative fluorescence microscopy images of MCF‐10A cells without (left) and with (right) NaAsO2 treatment (yellow dots represent SGs). B) Representative amperometric traces of SGs isolated from a non‐cancer cell (MCF‐10A) obtained from CFME (upper) and platinized CFME at 400 mV vs. Ag/AgCl (lower), the inset shows an amplification of the spike labeled with the red asterisk.