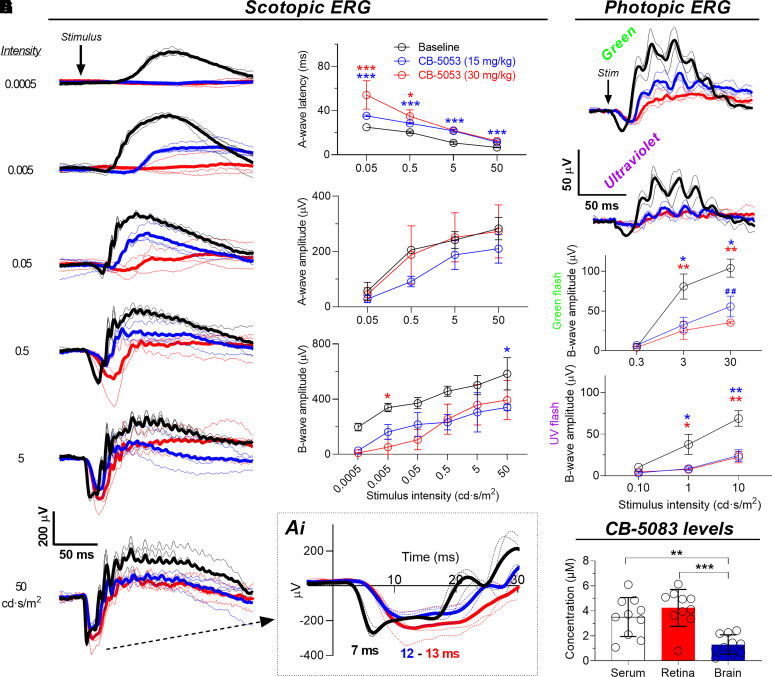
Fig. 1.
Single administration of CB-5083 delays photoreceptor activation to light and suppresses retinal function. Electroretinograms (ERGs) were first recorded in nontreated C57BL/6J mice (baseline, n = 3, black) and then in separate sessions 45 minutes after CB-5083 gavage administration using doses of 15 mg/kg (blue, n = 3) and 30 mg/kg (red, n = 3), respectively. The sessions were separated by 1 week. Scotopic ERGs were recorded in fully dark-adapted mice. (A) Rod-dominant scotopic ERG waveforms. Thin traces are individual mouse responses, and thick lines are group averages. Inset Ai shows a magnified image of the A-wave leading edge at the highest stimulus strength and a-wave peak times. (B) A-wave latencies. (C) A-wave amplitudes. Repeated-measures ANOVA between-subjects main effect between baseline and 15 mg/kg CB-5083: P < 0.01. (D) B-wave amplitudes. (E and F) Photopic ERG waveforms in response to green (30 cd·s/m2, peak wavelength 544 nm) and UV (10 cd·s/m2, peak wavelength 365 nm) flashes stimulating the M- and S-cone photoreceptors, respectively. (G and H) Photopic ERG amplitudes. Statistical analysis: repeated-measures ANOVA followed by Bonferroni’s post hoc tests. *P < 0.05, **/##P < 0.01, ***P < 0.001. Asterisks mark significant difference between baseline and 15 mg/kg sildenafil (blue) or baseline and 30 mg/kg sildenafil (red). Pound signs in G mark difference between 15 mg/kg and 30 mg/kg sildenafil. ERG data are presented as mean ± S.D. (I) CB-5083 levels in mouse serum, retinae, and frontal cortex (brain) biopsy 1 hour after gavage administration (n = 10 in all). Statistical analysis: one-way ANOVA followed by Bonferroni’s post hoc test: **P < 0.01. Error bars denote S.D. Stim, stimulus.

