
Figure 3.
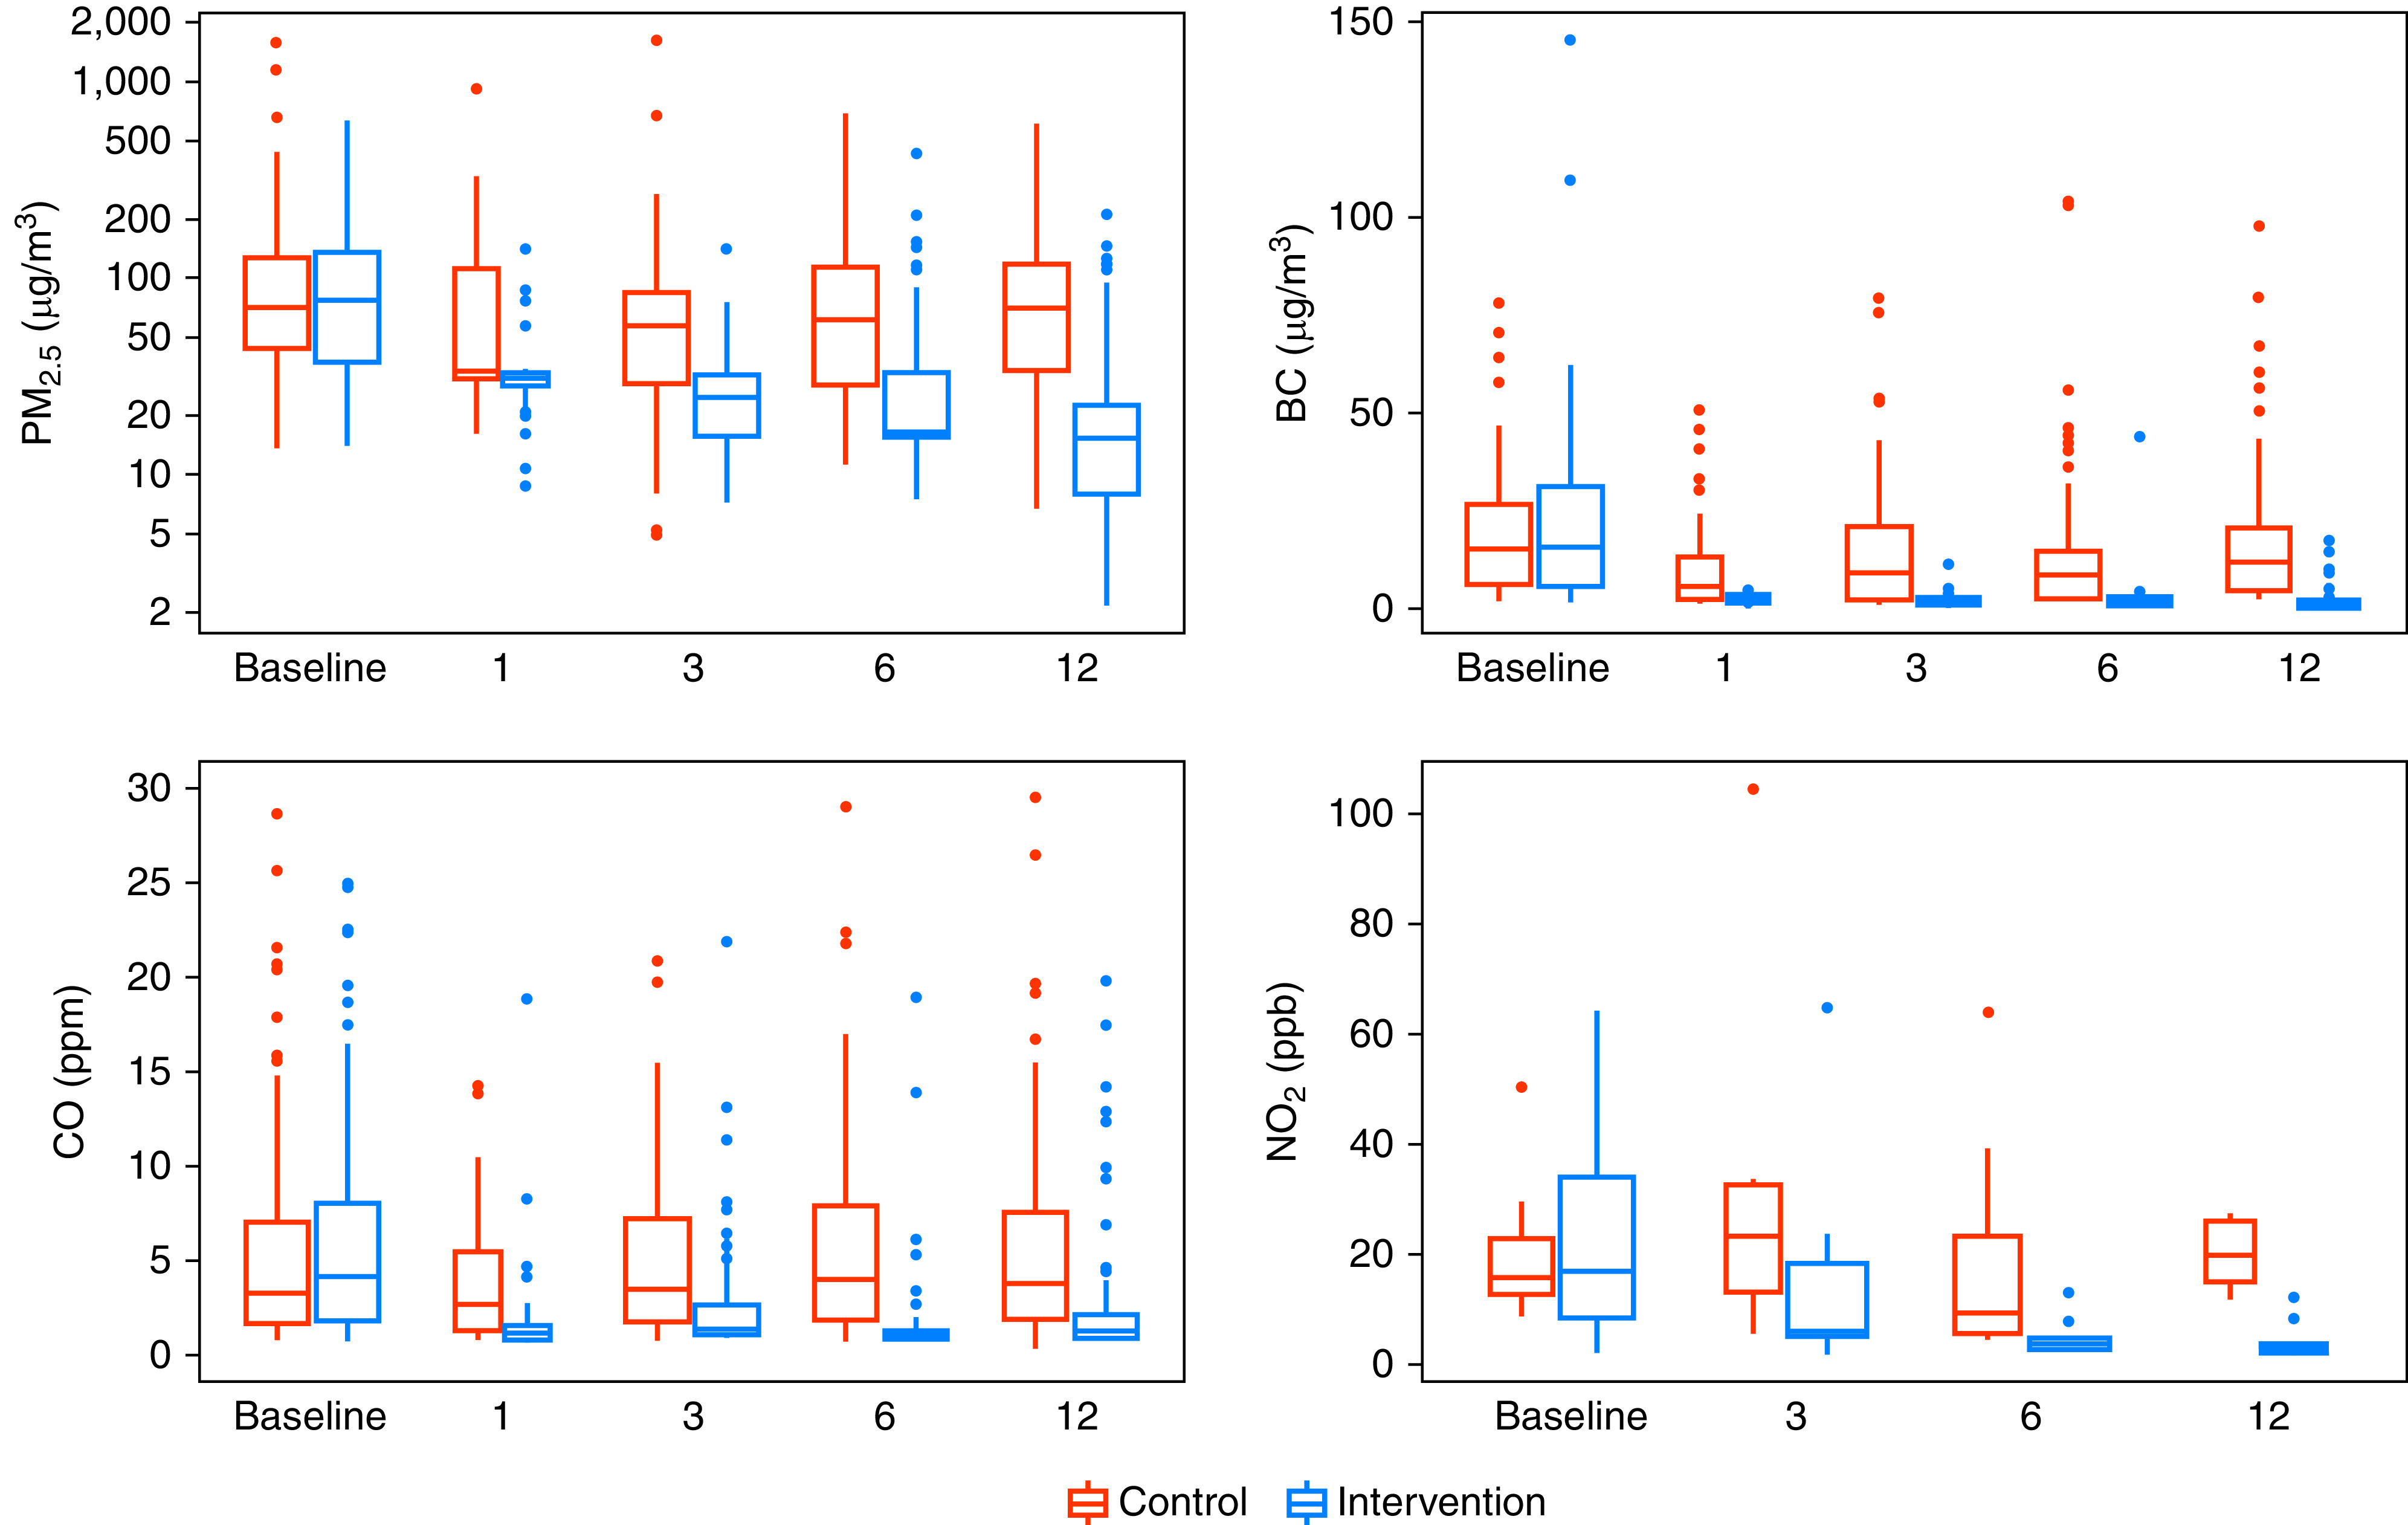
Boxplots of personal exposure to particulate matter ≤ 2.5 μm in aerodynamic diameter (PM2.5), black carbon (BC), carbon monoxide (CO), and nitrogen dioxide (NO2) by trial arm and visit. In each panel, control women are represented by red-colored boxplots and intervention women by blue-colored boxplots. The width of the barplots in each panel is proportional with sample size. The sample sizes for baseline and 1-, 3-, 6-, and 12-month visits for control households are as follows: PM2.5 and BC (n0 = 90, n1 = 40, n3 = 87, n6 = 90, n12 = 90), CO (n0 = 81, n1 = 41, n3 = 79, n6 = 81, n12 = 81), and NO2 (n0 = 8, n3 = 6, n6 = 9, n12 = 5). The sample sizes for baseline and 1-, 3-, 6-, and 12-month visits for intervention households are as follows: PM2.5 and BC (n0 = 90, n1 = 45, n3 = 90, n6 = 89, n12 = 87), CO (n0 = 79, n1 = 38, n3 = 76, n6 = 79, n12 = 79), and NO2 (n0 = 11, n3 = 13, n6 = 13, n12 = 9).