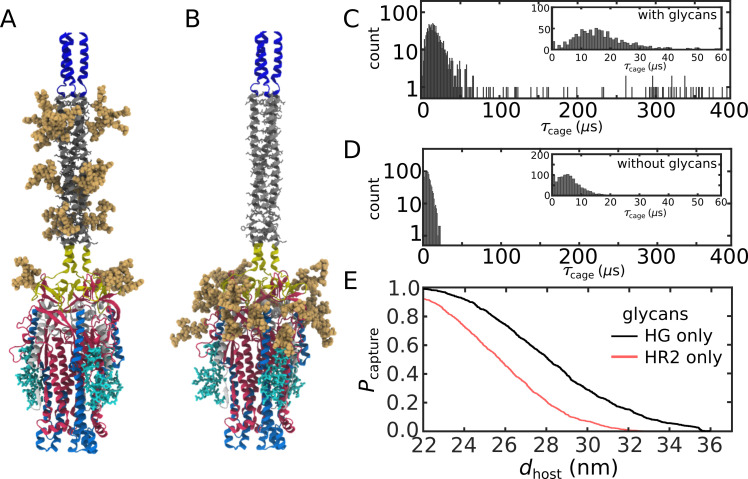
Appendix 1—figure 6. Relative influence of glycans on HR2 and HG.
(A) Structural model with only glycans shown on HG. (B) Structural model with only HR2 glycans present. (C) Distribution of timescales with only HG glycans present. (D) Distribution with only HR2 glycans present. (E) Probability that for at least one FP. There is a higher probability of extending to dhost when only HG glycans are present than when only HR2 glycans are present (black vs. red curves).

