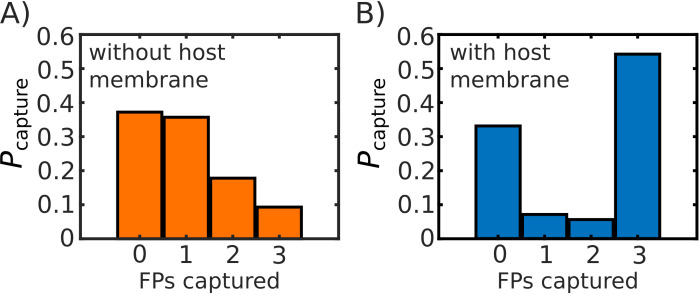
Appendix 1—figure 8. Comparison of probability of FP capture with, and without, a host membrane potential.
Probability of capture, calculated from 1000 simulated transitions. (A) Model with no host membrane, using to define capture. (B) Model with host membrane potential as defined in Equation S1, which traps (i.e. potential begins to decrease) FPs at ∼27 nm from the virtual viral membrane. Both (A) and (B) show approximately the same probability of 0 FPs being captured, while (B) shows a drastic increase on the probability that capture will involve all three FPs.

