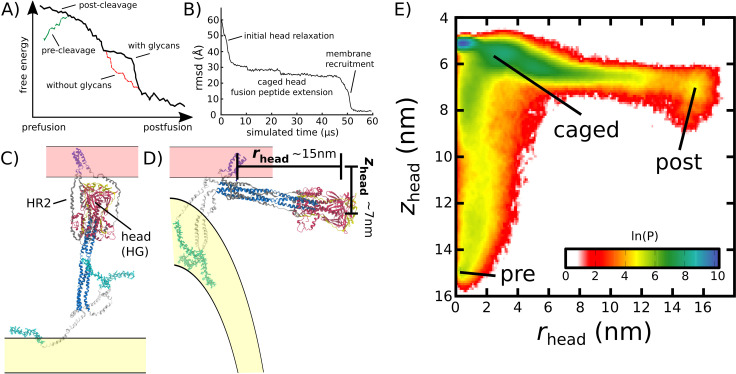
Figure 2. Simulating Spike-protein-mediated membrane fusion. Simulations with an all-atom structure-based model (Whitford et al., 2009; Noel et al., 2016) allow for transitions between prefusion and postfusion configurations to be observed.
(A) Schematic representation of the energetics in the structure-based model. The postfusion configuration was defined as the global potential energy minimum. The pre-cleavage state (green) is assumed to be stable, where cleavage and release of S1 leads to an unstable prefusion configuration (black). While, in the employed model, stabilizing energetic terms favor the postfusion configuration, steric interactions between the protein and glycans may impede the motion (black vs. red). (B) Representative simulation (1 of 1000) of the pre-to-post transition. Spatial rmsd from the post configuration (excluding TM, CR, and FPs) is shown, as a function of time. The simulation included explicit glycans, as well as an effective viral membrane potential. (C) After an initial relaxation phase (panel B), the head (red) appears to become caged by the HR2 strands (gray), allowing it to sample configurations near the viral membrane (pink). While the host membrane (yellow) was not included in the simulations, it is depicted for illustrative purposes. (D) After reaching the caged ensemble, the head escapes and the HR1-HR2 superhelix assembles. The position of the head group, relative to the TM region (blue), is described by the cylindrical coordinates rhead and zhead. The origin is defined as the geometric center of TM, and the cylindrical axis is perpendicular to the viral membrane. See Materials and methods for details. (E) Probability distribution of simulated events (with glycans) reveals an obligatory cage-like intermediate.

