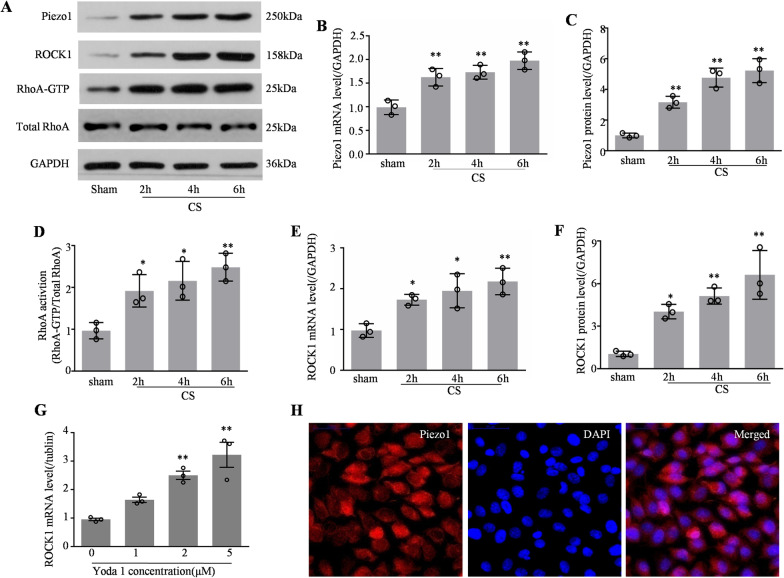
Fig. 3.
Increased Piezo1 activated the RhoA/ROCK1 pathway in CS-treated HPMECs. A Western blotting showing Piezo1, ROCK1, RhoA, and GAPDH levels in the sham, CS 2, 4, and 6 h cells. B Quantitative analysis of Piezo1 mRNA expression using qPCR in CS-treated cells (n = 3). C Quantitative analysis of Piezo1 protein levels in CS-treated cells (n = 3). D Active GTP-RhoA was assessed using a pull-down assay after CS treatment (n = 3). E Quantitative analysis of ROCK1 mRNA expression by qPCR in CS-treated cells (n = 3). F Quantitative analysis of ROCK1 protein levels in CS-treated cells (n = 3). G Quantitative analysis of ROCK1 mRNA expression using qPCR in Yoda1-treated cells (n = 3). H Representative immunocytochemical images in HPMECs. Piezo1, and DAPI were used as markers for Piezo1 protein expression and nuclei, respectively. Scale bar = 50 μm. Data are shown as the mean ± SEM. *P < 0.05, **P < 0.01 versus the sham group. CS cyclic stretch, HPMEC human pulmonary microvascular endothelial cell, qPCR quantitative real-time PCR, DAPI 4′,6-diamidino-2-phenylindole

