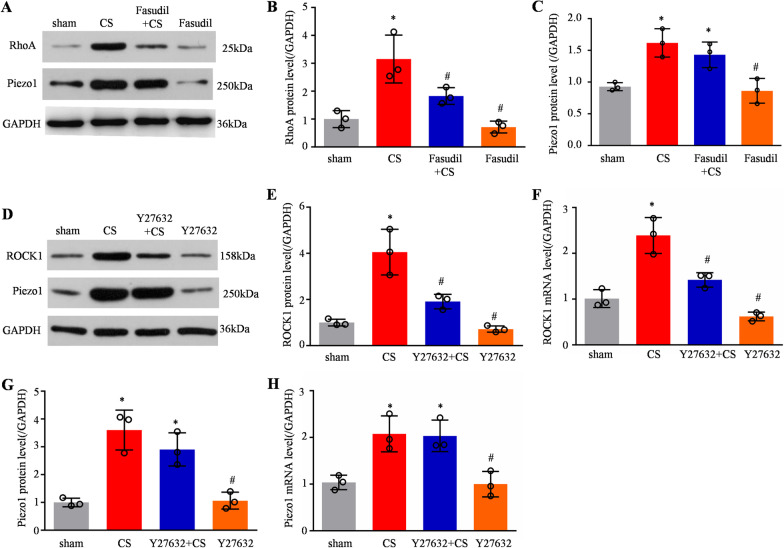
Fig. 5.
Inhibition of the RhoA/ROCK1 pathway did not affect the expression of Piezo1 in HPMECs. A Western blotting showed Piezo1, RhoA, and GAPDH levels in sham, CS, ad-fasudil + CS, and ad-fasudil cells. Quantitative analysis of RhoA B and Piezo1 C protein levels in the above cells (n = 3). D Western blotting showing ROCK1, Piezo1 and GAPDH level in sham, CS, ad-Y27632 + CS, and ad-Y27632 cells. Quantitative analysis of ROCK1 E and Piezo1 G protein levels in the above cells (n = 3). Quantitative analysis of ROCK1 F and Piezo1 H mRNA expression using qPCR in above cells (n = 3). Data are shown as the mean ± SEM. *P < 0.05 versus the sham group and #P < 0.05 versus the CS group. CS cyclic stretch, HPMEC human pulmonary microvascular endothelial cell, qPCR quantitative real-time PCR

