Fig 2.
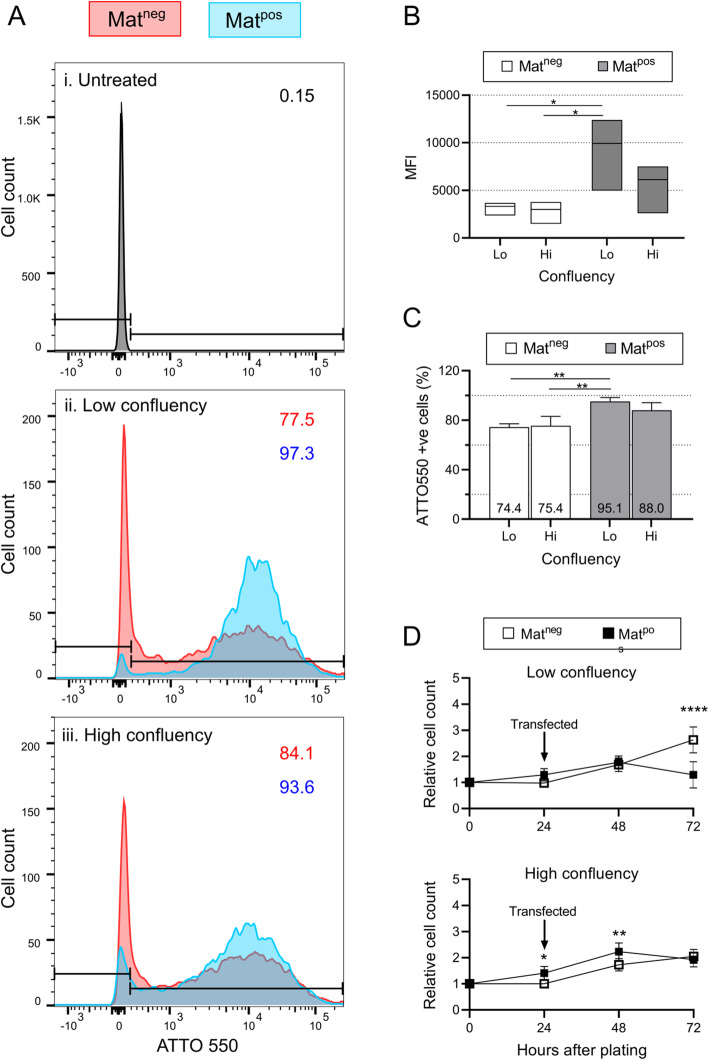
Maximal transfection of skMDCs was achieved using Matrigel and low cell confluency. Fluorescence activated cell sorting (FACS) was used to analyze the proportion of ATTO 550+ cells under different transfection conditions. A Images from skMDC-42F are shown as representative images of all three lines. ATTO 550+ gates were set on the untreated sample (i). The X axes show the median fluorescence intensity (MFI) for ATTO 550 in cells transfected at low (ii) and high (iii) confluency. The percentage of cells that are ATTO 550+ are shown for Matneg (red) and Matpos (blue) conditions. B The MFI is highest in cells transfected under Lo/Matpos conditions. Box plots illustrate minimum, maximum and median MFIs across the 3 cell lines. C Transfection efficiencies were quantified in three skMDC lines under different conditions. Data represent mean ± SD. One-way ANOVA with Holm-Sidak’s multiple comparison test was performed, n=3 per condition (1× 18M, 1× 32F, 1× 42F); ** = p < 0.01. D Proliferation rate of transfected skMDCs relative to the number of cells plated (values normalised to 1 at 0 h). Data reported are mean ± SD. Two-way ANOVA with Sidak’s multiple comparison was performed, n = 5 (1× 18M, 1× 32F, 3× 42F); * = p < 0.05; ** = p < 0.01; **** = p < 0.0001. UT = Untreated; Lo = low confluency, Hi = high confluency; Matneg = uncoated wells; Matpos = Matrigel coated wells

