
Figure 8.
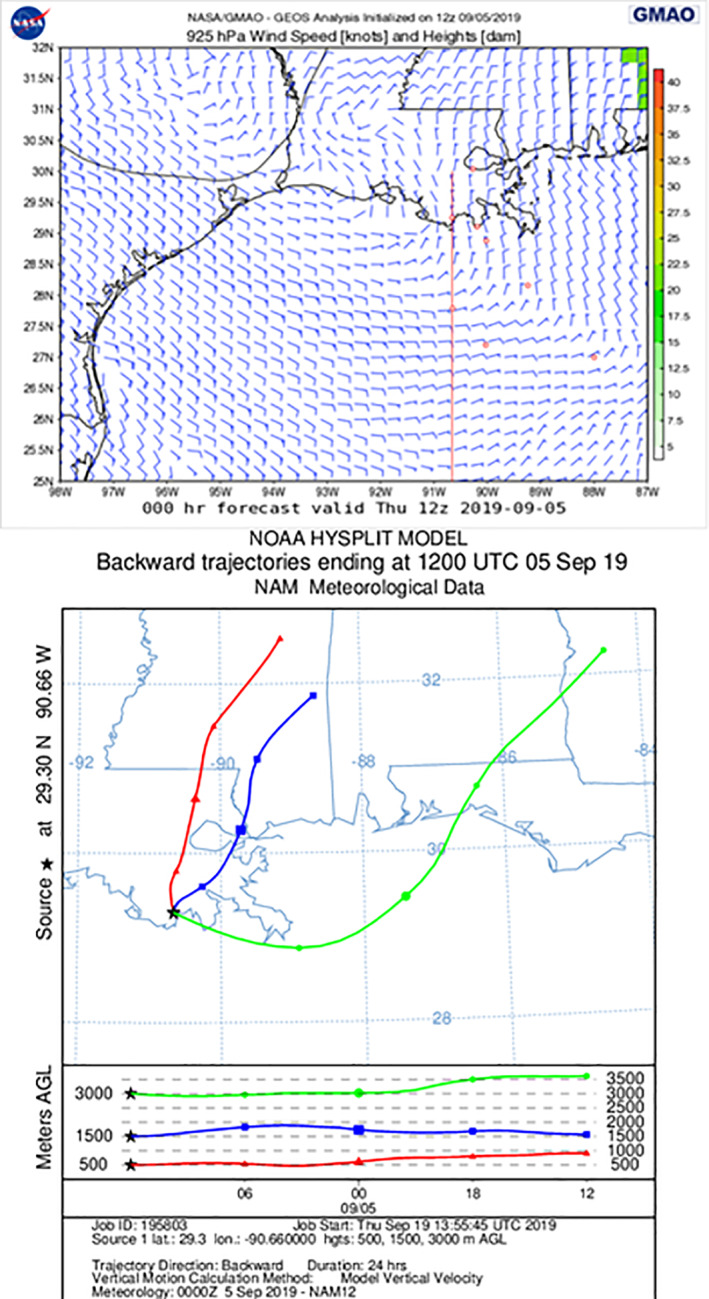
(Top) Wind speed and direction from GEOS Forward Processing system visualized with Framework for Live User‐Invoked Data (FLUID). Feathers on wind barbs indicate the strength (longer for stronger) and direction the wind is blowing from. (bottom) Backward trajectories from the HYSPLIT model on September 5, 2019. The red dots and line (top) represent the locations of specialized forecasts on FLUID created for a field campaign associated with the BOEM‐NASA interagency agreement; they correspond to cities, major ONG platforms and the Louisiana Offshore Oil Port (LOOP) (see Figure 9).