
Figure 9.
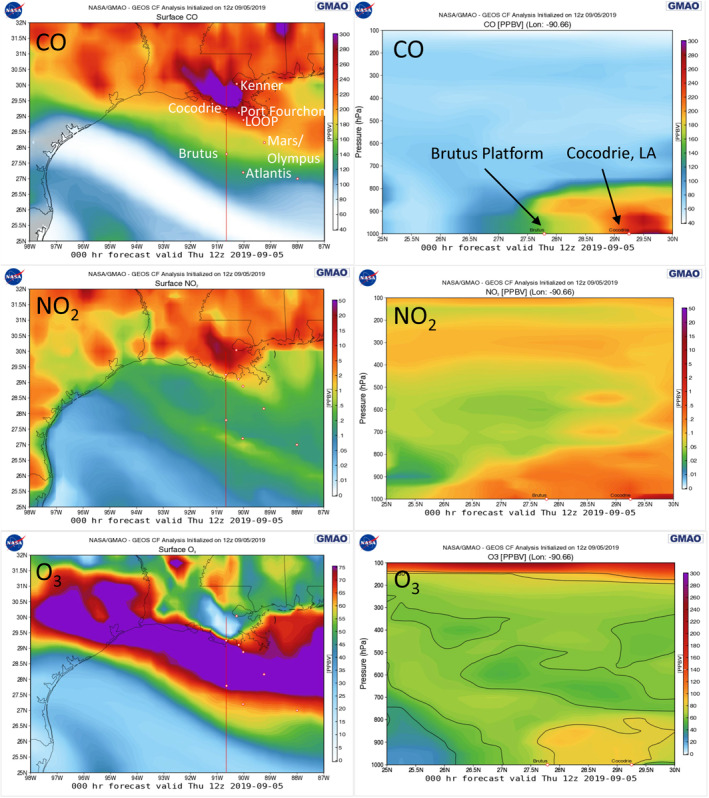
Simulated concentrations for CO (top), NO2 (middle), and O3 (bottom) from the Goddard Earth Observing System‐Composition Forecast forecasts accessed via Framework for Live User‐Invoked Data in September 2019. Near‐surface concentrations for the region of interest are shown for September 5, 2019 (left). The red line in these figures (left) indicates the location for the corresponding cross‐section plots (right).