
Figure 11.
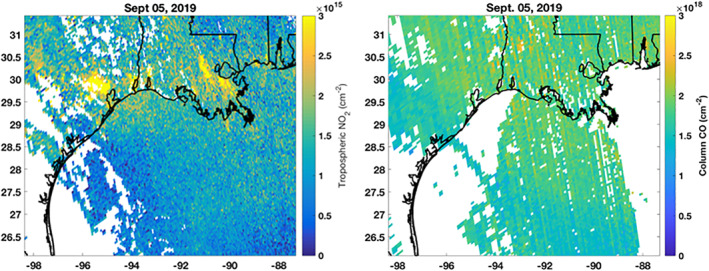
TROPOMI (left) tropospheric vertical column densities (VCDs) of NO2 (×1015 molecules/cm2) and (right) total VCDs of CO (×1018 molecules/cm2) on September 5, 2019. Refer to Figure 9 for locations of large ONG platforms in the Gulf of Mexico. TROPOMI data were downloaded from the NASA EarthData website (https://search.earthdata.nasa.gov/search).