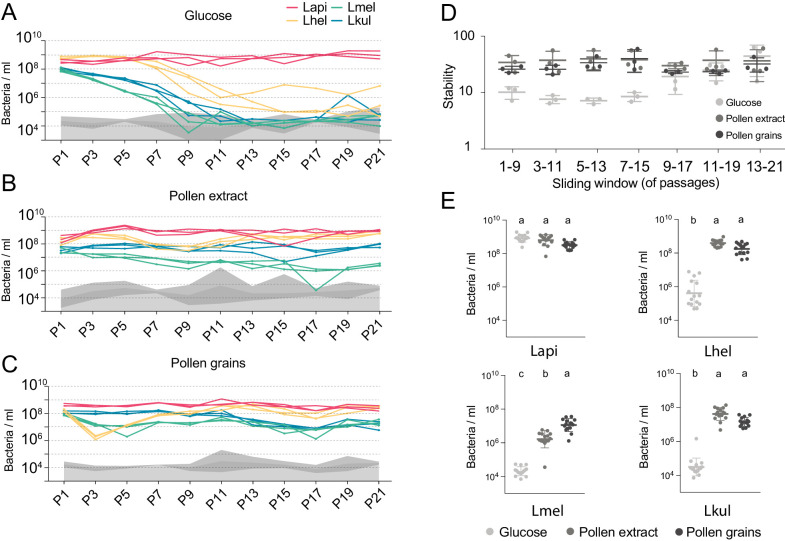
Figure 2. The stable coexistence of the four Lactobacillus species can be recapitulated in vitro in the presence of pollen.
(A–C) Changes in total abundance of the four species when serial passaged in co-culture for 21 times in minimal medium supplemented with (A) 2% (w/v) glucose, (B) 10% (v/v) pollen extract, and (C) 10% (v/v) pollen grains. The absolute abundance of each species was determined by multiplying the total number of CFUs with the proportion of each strain in a given sample as based on amplicon sequencing (see Materials and methods). Gray areas indicate the limit of detection as explained in the Materials and methods. (D) Community stability of each replicate calculated based on the species abundances for a sliding window of five passages with a step size of 1. (E) Absolute abundance of each species across the three treatments considering the replicates of passages 13–21, which is when the community reached stability. Statistical differences (ANOVA with Tuckey post-hoc test and BH correction) are depicted by different letters.
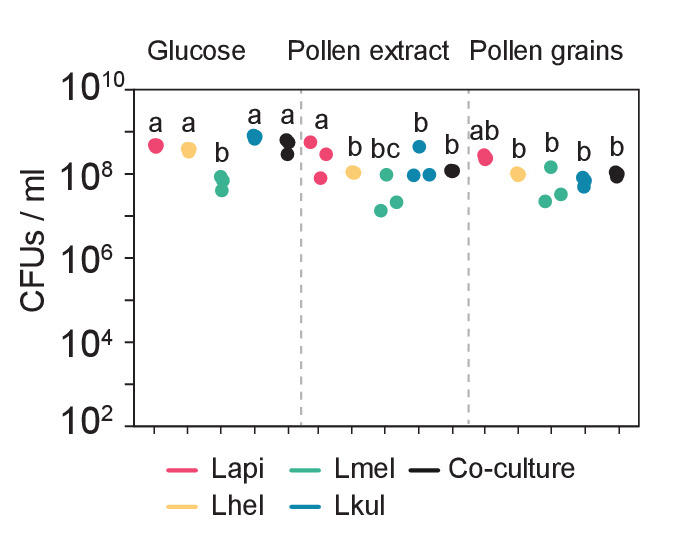
Figure 2—figure supplement 1. Colony-forming units (CFUs) per ml of culture after 24 hr of growth of the four species in mono-cultures (n=3) or in co-culture (n=3) in the presence of 2% (w/v) glucose (G), 10% pollen extract (PE), or 10% pollen grains (PG).

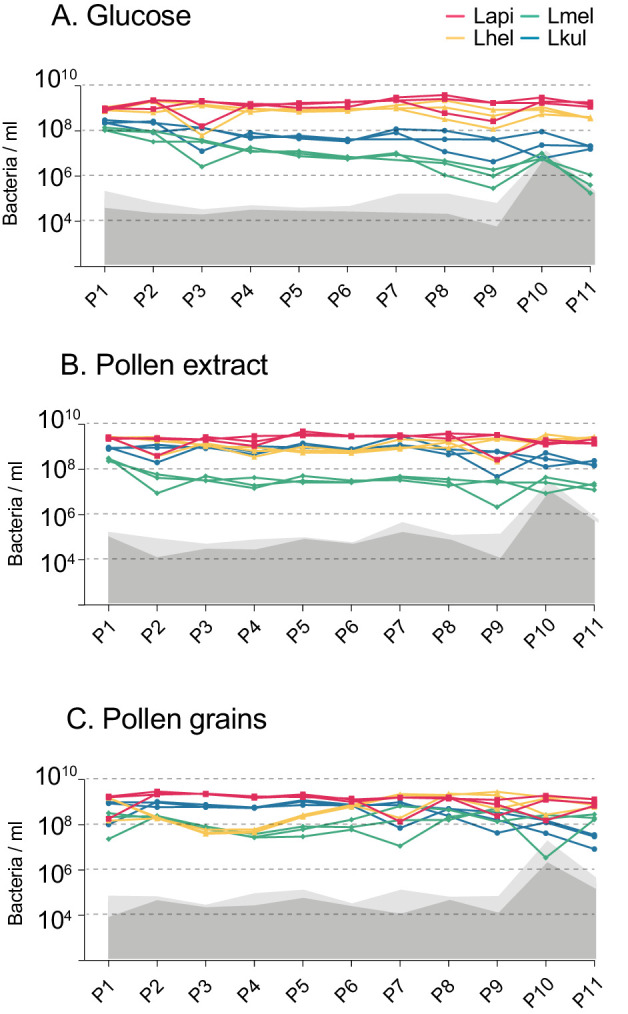
Figure 2—figure supplement 2. Second in vitro transfer experiment.


