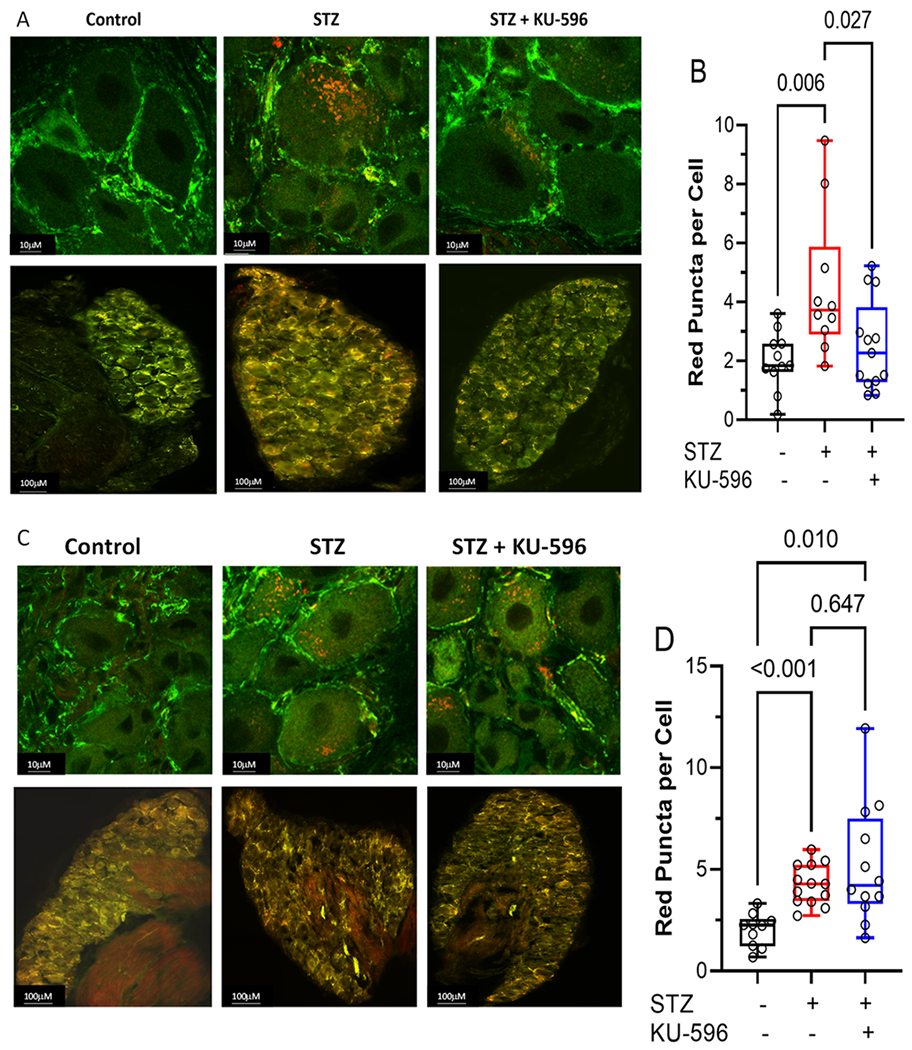
Figure 5.

KU-596 decreased mitophagy in (A and B) MQC but not (C and D) MQC × Hsp70 diabetic neurons. (A and C) Top panels show representative images of sensory neurons and bottom panels show the entire DRG. (B and D) Symbols represent average puncta per cell from one animal. The number of cells counted per ganglia ranged from 50 to 100. Box, 25th, median, and 75th percentiles; whiskers, minimum, and maximum.
