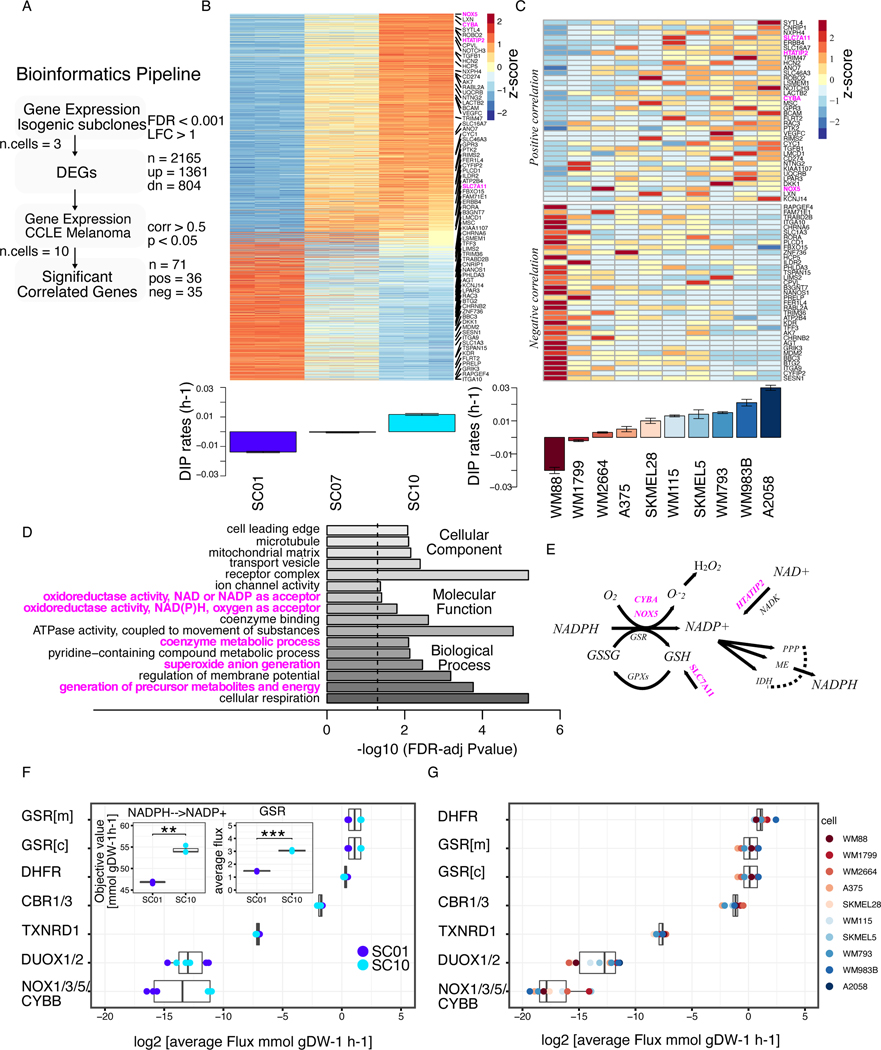
Figure 1: BRAF-mutated melanoma cells with reduced sensitivity to BRAF-inhibition show elevated redox capacity.
(A) Bioinformatics pipeline to identify genes correlated with drug sensitivity, extension of an approach in previously published report (24). Briefly, Differentially Expressed Genes (DEGs) were identified from gene expression of isogenic subclones. Expressions of the identified genes were then correlated with DIP rates in CCLE melanoma panel. Statistical criteria used shown in the pipeline. (B) Heatmap of DEGs among subclones (top); Barplot of DIP rates of three subclones, SC01, SC07, and SC10 in 8 μM PLX4720 (bottom); (C) Heatmap of 71 genes from melanoma cell lines in CCLE panel that show a significant correlation between their expression and drug sensitivity. Genes in the upper panel show positive correlation, while genes in the lower panel show negative correlation to DIP rates. Highlighted in magenta are the redox-related genes involved in NADPH oxidation (top); Barplot of quantified DIP rates for the indicated melanoma cells in 8 μM PLX4720 (bottom). (D) Enriched Gene Ontology (GO) terms of the significant, and positively correlated genes from Figs. 1B, and C, and their FDR-adjusted p-values on barplot. (E) Schematic of the redox axis of NADPH oxidation, genes highlighted in magenta are the genes that are positively correlated in Fig. 1C. (F) Average FBA predicted metabolic fluxes through NADPH oxidation reactions between two single-cell-derived SKMEL5 subclones models, SC01, and SC10; three replicates of the model were considered. Inset (left) shows the objective value for net conversion of NADPH to NADP+ for two subclones (p-value = 3.79e-3); inset (right) average fluxes through one of NADPH oxidizing reactions, GSR (p-value = 2.72e-5)) (G) Average FBA predicted metabolic fluxes through NADPH oxidation reactions in CCLE melanoma cell line models. * p <= 0.05, ** p <= 0.01, *** p <= 0.001, **** p <= 0.0001.

