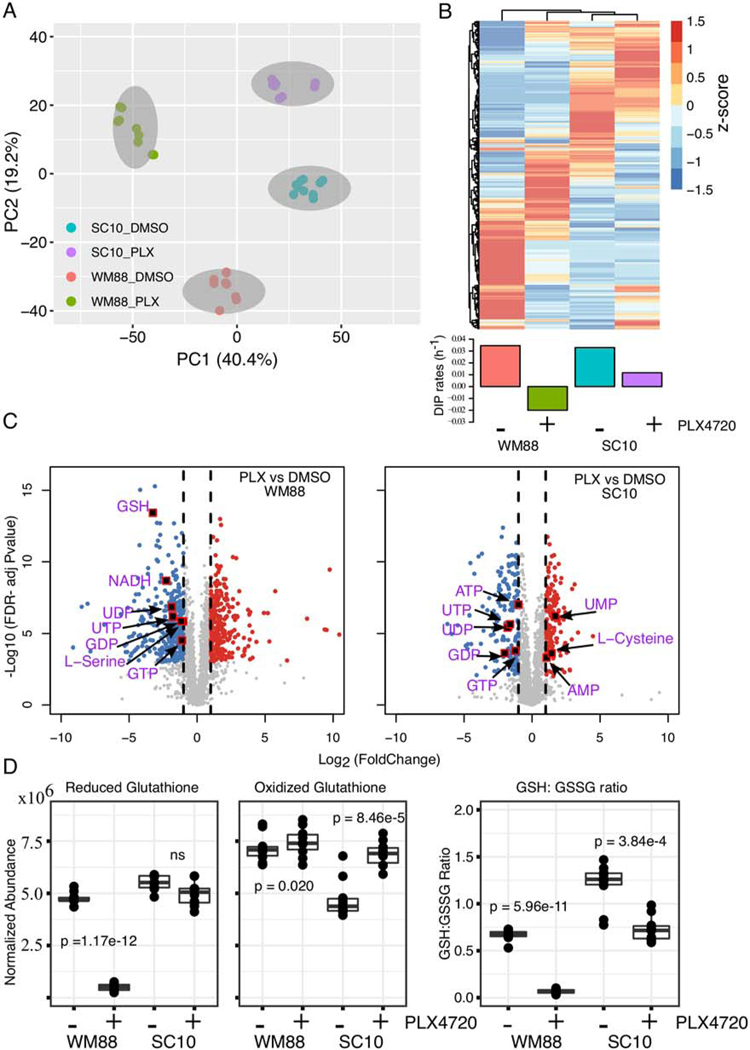
Figure 2: Global metabolomic analysis reveals distinct metabolite profiles in BRAF-mutated melanoma cells with differing drug sensitivities.
(A) Principal component analysis (PCA) of metabolite profiles for two BRAF-mutated melanoma cells, WM88, and SC10 (SKMEL5-SC10), treated either in DMSO or 8 μM PLX4720 for 24 h. The two cell lines cluster and separate along PC1, while the drug-treated samples separate along PC2. (b) Heatmap analysis of identified metabolites in two melanoma cells (WM88 and SC10) either in DMSO or PLX4720 treatment (top) provides a global comparison of the relative abundances of individual metabolite compounds across the different groups; Barplot of DIP rates in WM88, and SC10 in DMSO or in 8 μM PLX4720 (bottom). (C) Volcano plots showing differentially expressed metabolites after treatment of two melanoma cells (WM88 or SC10) with 8 μM PLX4720 for 24 h. The negative log10 transformed Bonferroni corrected P-values (y-axis) are plotted against the average log2 fold changes in metabolite abundance (x-axis). Grey represents metabolites not differentially expressed, red are upregulated metabolites, and blue are downregulated metabolites. Vertical dotted lines represent log2 fold change of 1 or −1. Statistical cutoff of FDR-adjusted p-values < 0.001, and log-fold change greater or equal to 1 was used. (D) Box plots showing normalized abundances of reduced glutathione (GSH), oxidized glutathione (GSSG), and the ratio of GSH and GSSG in indicated melanoma cells treated with either DMSO or 8μM PLX4720 for 24 h: the solid line is the median, the box spans the first, and third quartiles, the whiskers extend to 1.5x the interquartile range--total of 10 replicates shown. Statistical significance calculated by paired t test, p-values as indicated in the figure.

