
FIGURE 3.
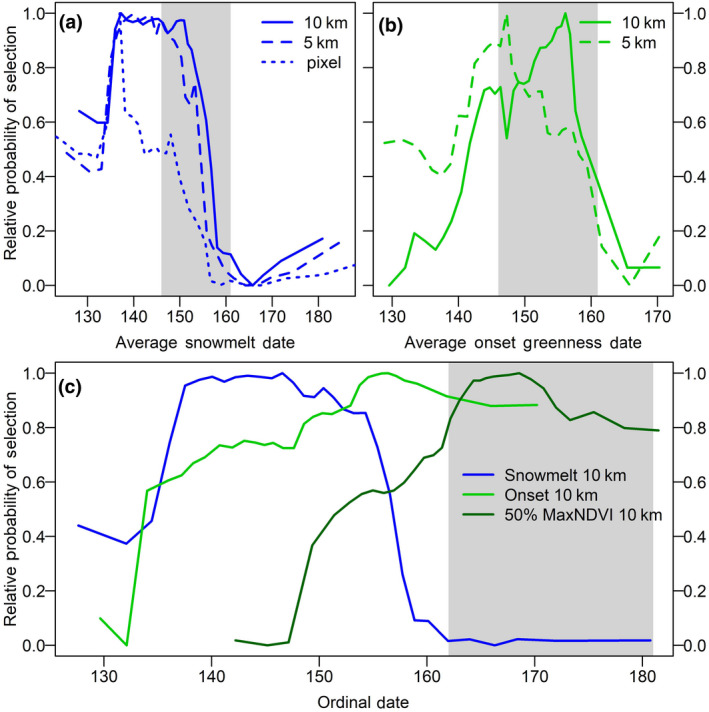
Partial dependence plots for caribou selection of phenology variables during the calving (a, b) and post‐calving (c) seasons by the Porcupine Caribou Herd, 2012–2018. Gray polygons depict the timing of either the calving or post‐calving season, respectively. During the calving season, snow melt date (a) was included in the model at three spatial scales and the onset of greenness was included at two scales (b). During the post‐calving season, the phenology variables were included in the model at only one spatial scale (c)