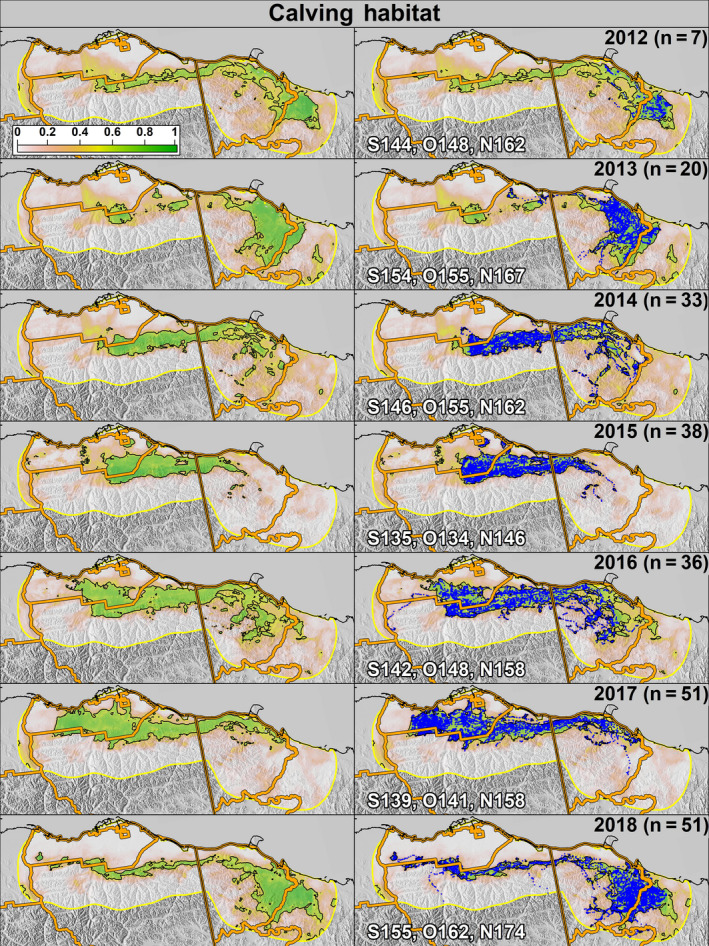
FIGURE 4.

Predicted probability of calving habitat use for the Porcupine Caribou Herd from 2012 (top) to 2018 (bottom) as a function of annual variation in snow melt and vegetation greening. The left column shows only the predicted probabilities and the right column includes caribou locations (blue dots). The number of individuals tracked each year is represented as “n.” The black outline depicts areas classified as suitable habitat. White lettering represents the median ordinal date of snow melt (S), onset of greenness (O), and 50% max NDVI (N) in the study area each year
