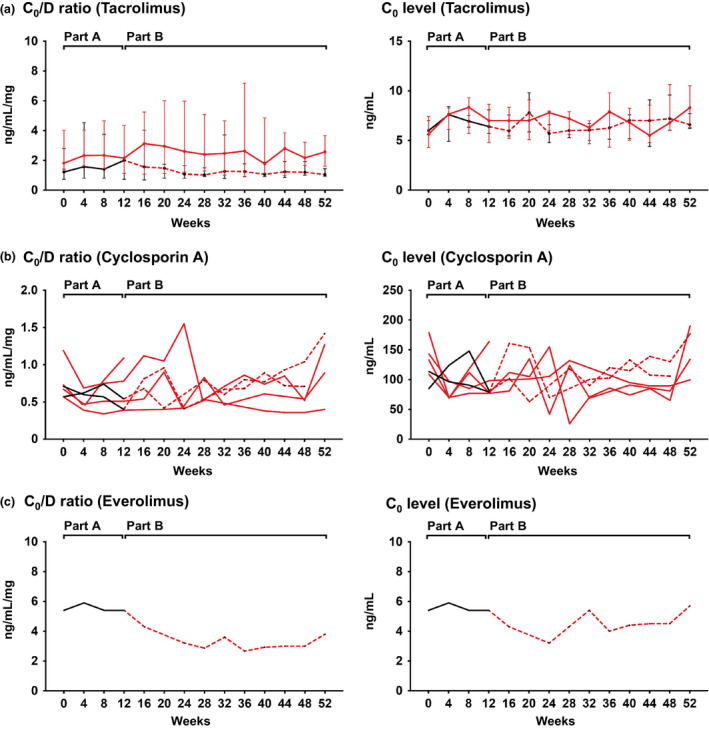
Figure 3.

Immunosuppressant C0 level/dose (C0/D) ratio and C0 levels. Results are shown for tacrolimus (a, median and interquartile range), cyclosporin A (b, individual course), and everolimus (c, individual course), in relation to treatment allocation (placebo: black [part A] and hatched red lines [part B]; clazakizumab: red lines [part A and part B]. For part A, data were available for all patients, and for part B, because of study withdrawal of two patients, for 18 subjects.
