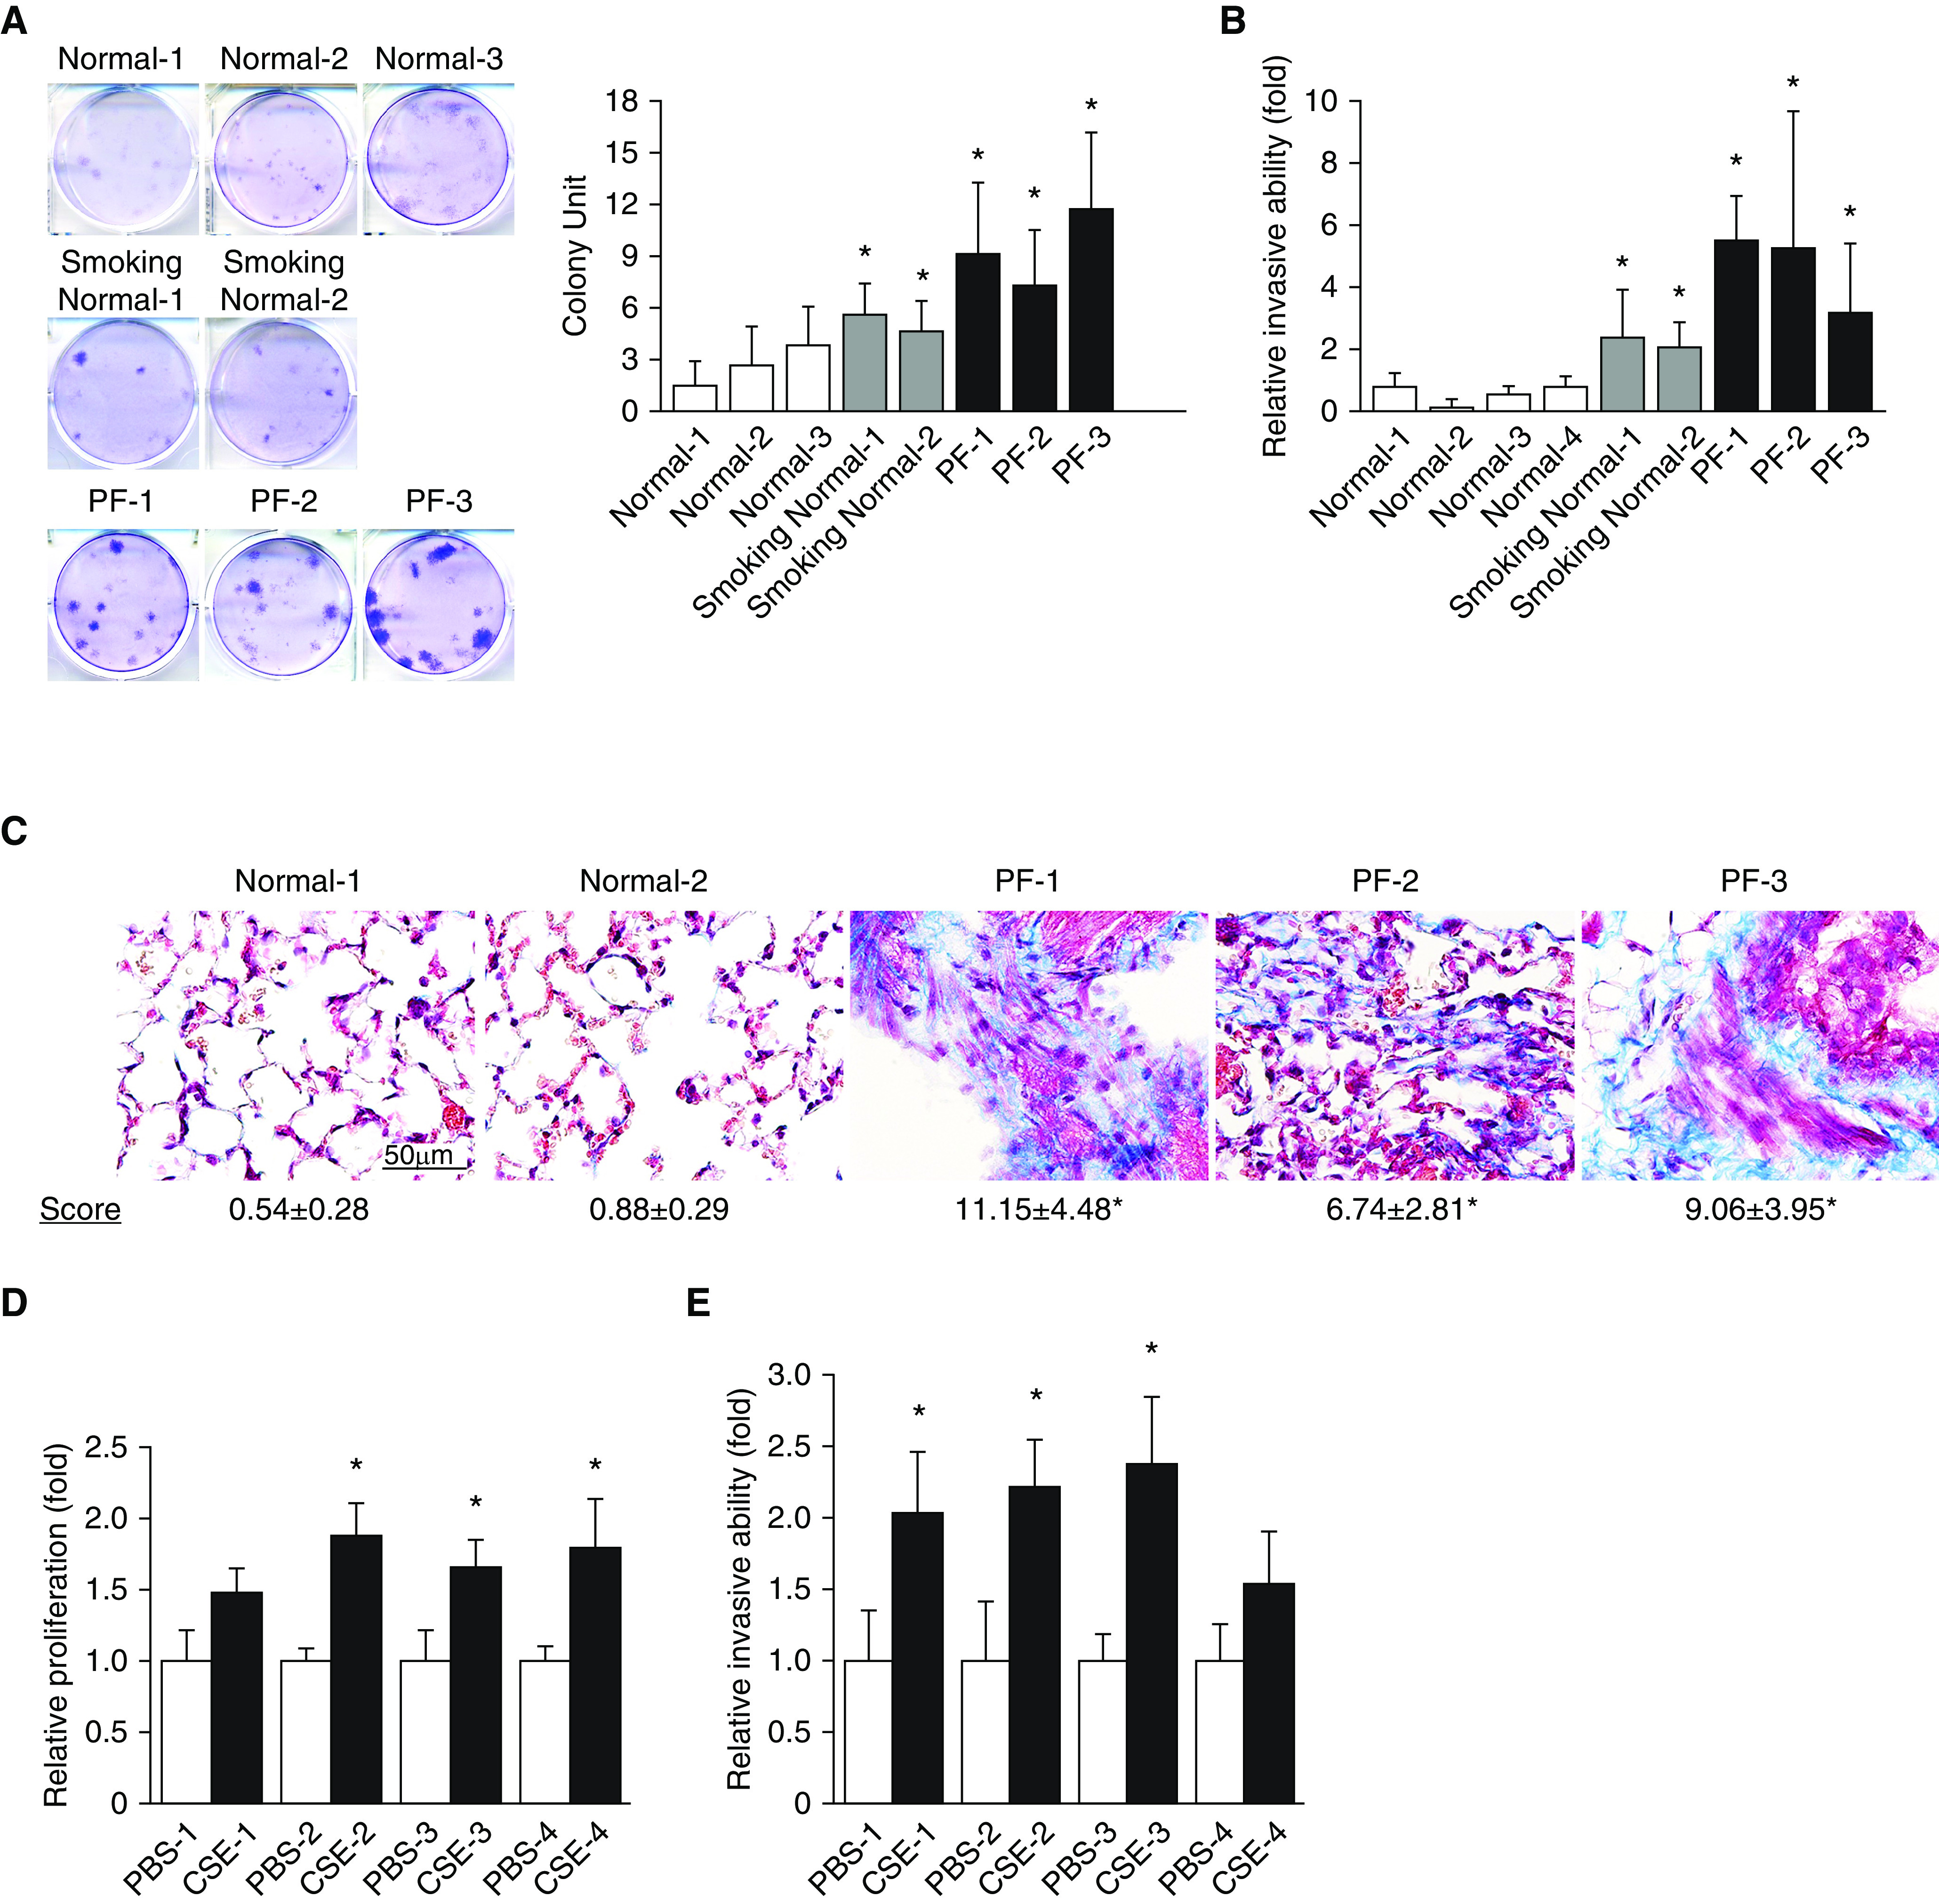
Figure 1.

Aggressive nature of smoke-exposed fibroblasts in lung fibrosis. (A) Cells were seeded to grow for 9 days, and cell colonies were counted after crystal violet staining. Left, representative images of three independent experiments. Right, colony units expressed as means ± SD (n = 5). *P < 0.05 compared with Normal-1. (B) Comparison of invasion ability between normal, smoking normal, and PF cells as determined by Matrigel transwell invasion assays. Cells were plated on Transwells for 20 hours, and those that migrated to the lower chamber were fixed, stained, and counted using light microscopy. Data are expressed as means ± SD (n = 4). *P < 0.05 compared with Normal-1. (C) Representative Masson trichrome–stained sections of mouse lung implanted with indicated fibroblasts. Bottom, semiquantitative fibrosis scores from Masson trichrome–stained sections of mouse lung. Fibrosis score is expressed as the percentage of positive staining area per high-powered field. Analysis of 6–12 high-powered fields per lung was performed with ImageJ software. *P < 0.05. Scale bar, 50 μm. (D) Cells were seeded to grow for 72 hours and then subjected to MTS proliferation assays. *P < 0.05 compared with PBS-exposed counterpart. (E) Comparison of invasion capability between PBS- and CSE-exposed cells as determined by Matrigel transwell invasion assays. Data are expressed as means ± SD (n = 4). *P < 0.05 compared with PBS-exposed counterpart. CSE = cigarette smoke extract; PF = pulmonary fibrosis.
