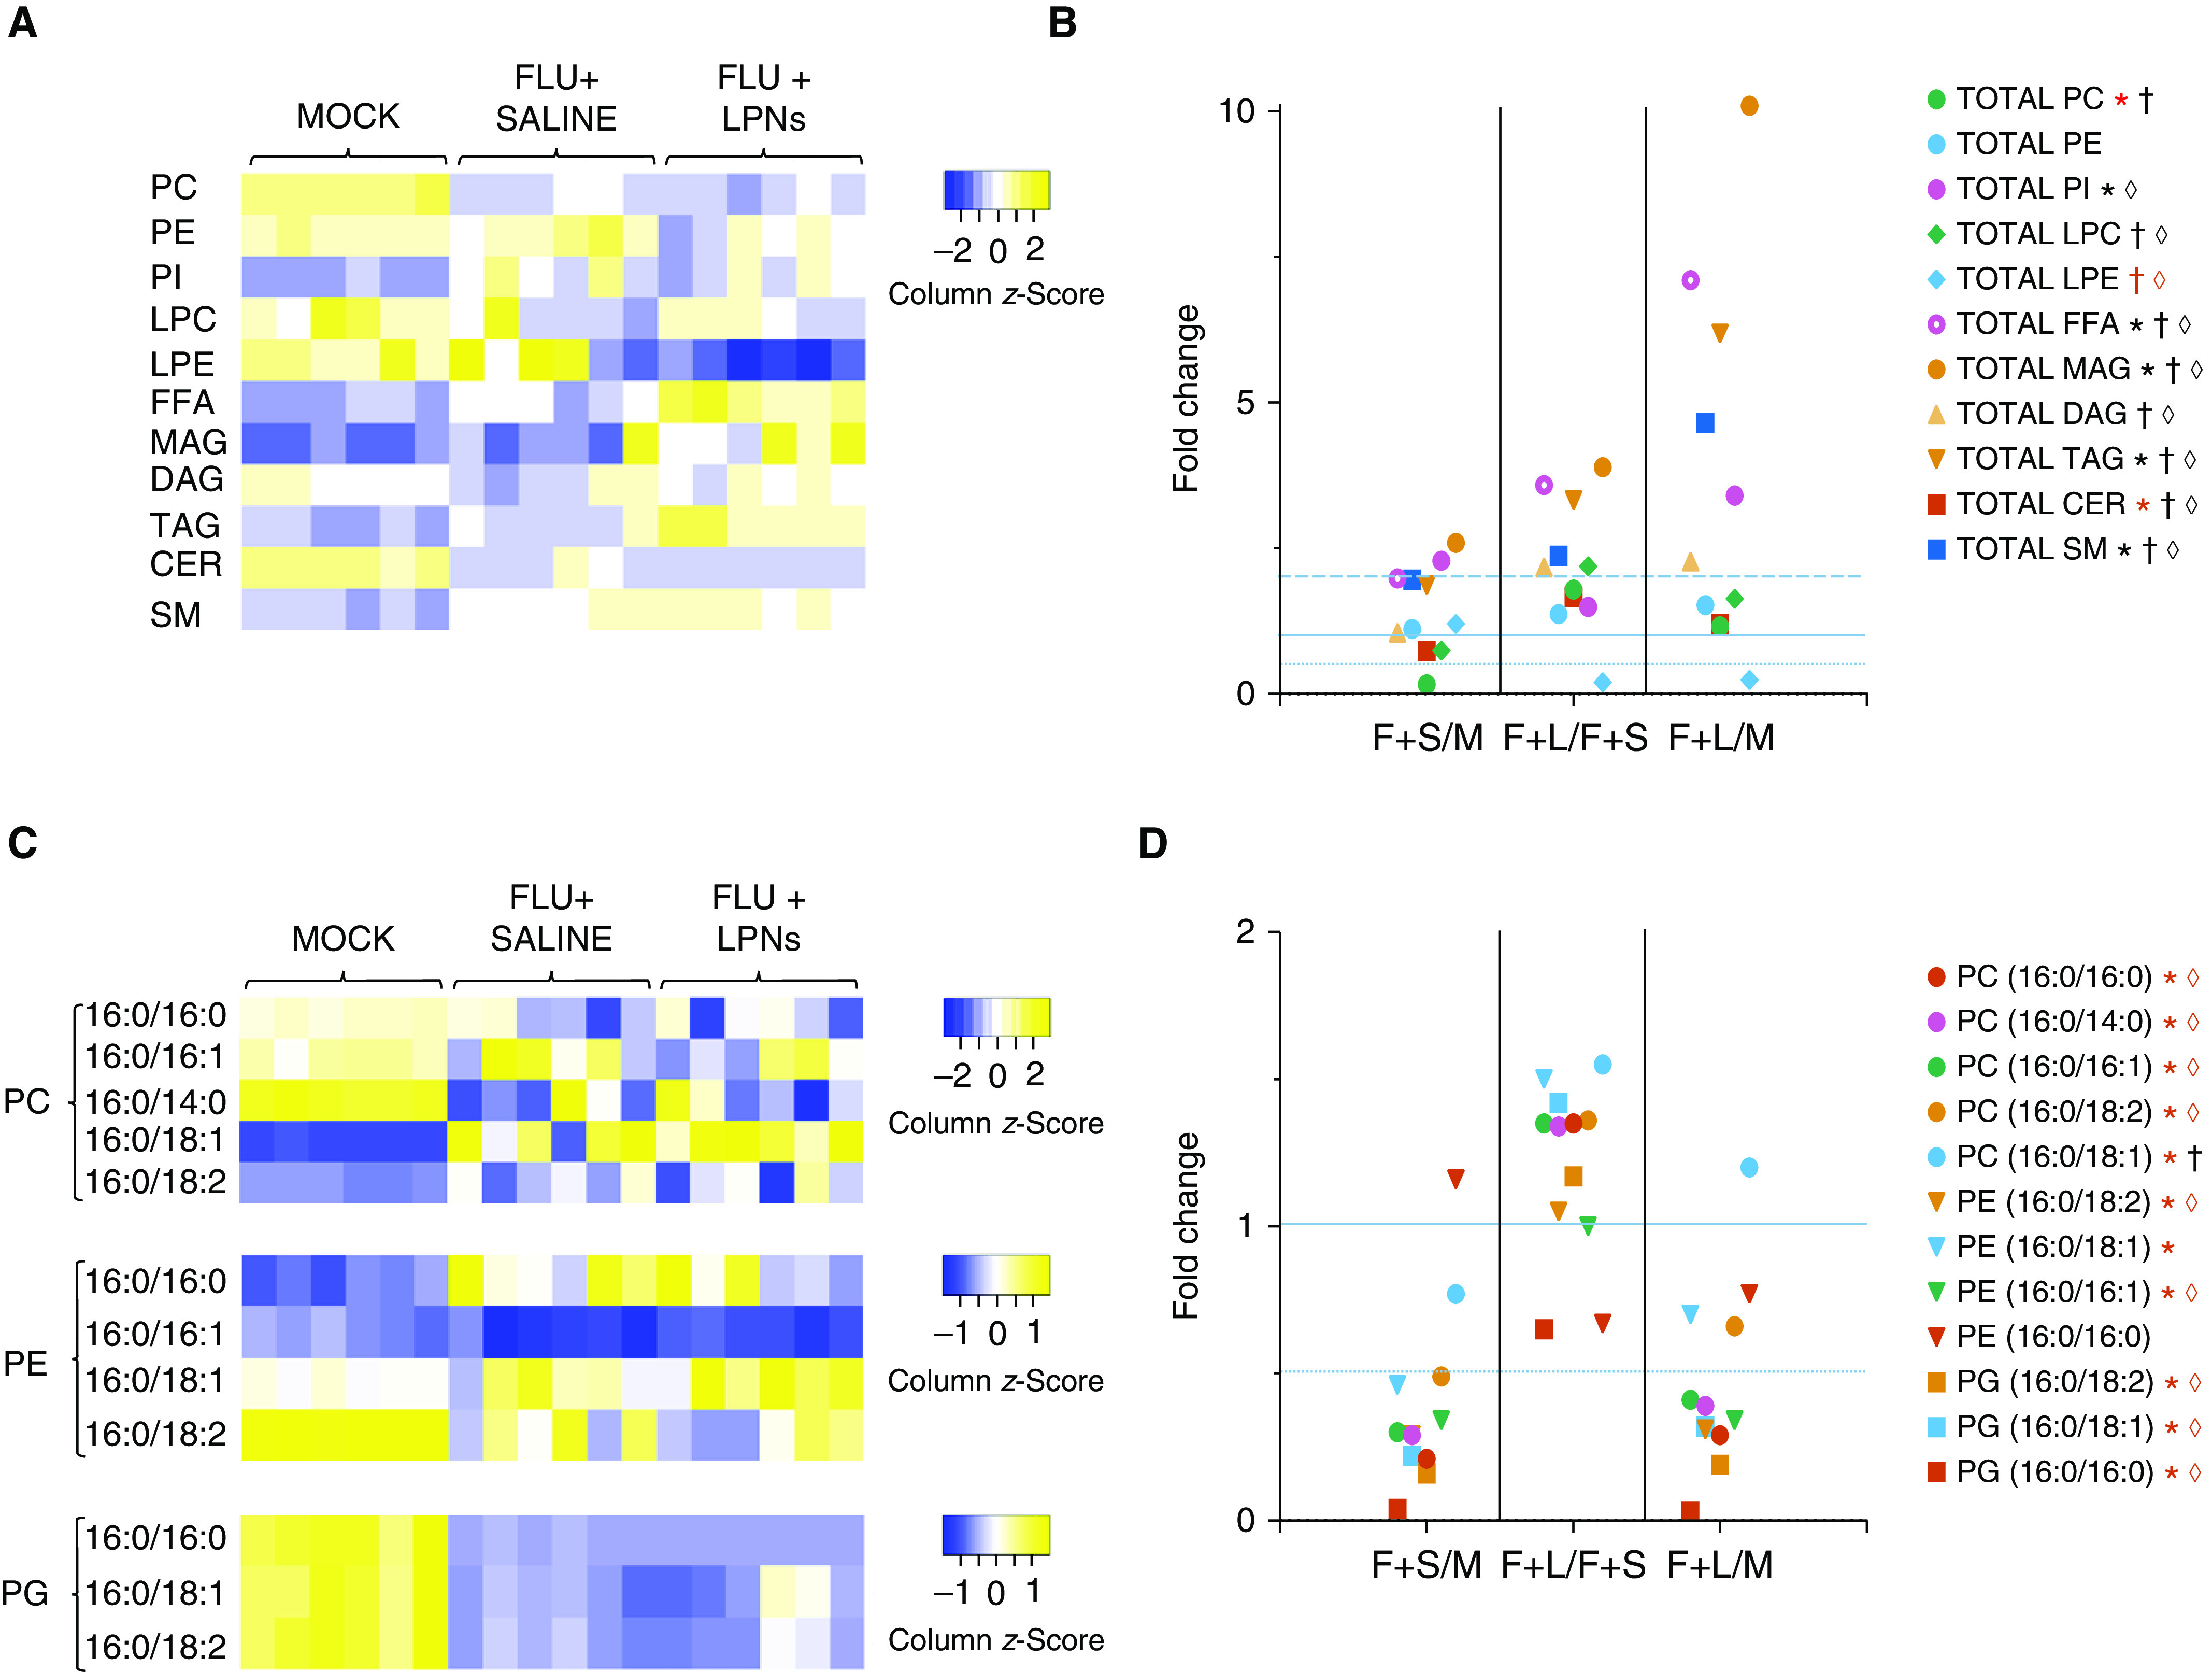
Figure 5.

PEP with CDP-CHO + CDP-DAG significantly modifies the alveolar type II (ATII) cell lipidome. Effect of treating mice infected with H1N1 influenza A/WSN/33 (10,000 pfu/mouse) with sterile 0.9% saline (50 μl/mouse i.p.) or 100 μg/mouse CDP-CHO + 10 μg/mouse CDP-DAG (in 50 μl sterile 0.9% saline i.p.) daily from 1 to 5 d.p.i. on (A) total amounts of phosphatidylcholine (PC), phosphatidylethanolamine (PE), PI, LPC, LPE, FFA, MAG, DAG, TAG, CER, and SM in ATII cells from individual mice in each treatment group at 6 d.p.i.; (B) mean fold-changes in total lipids between ATII cells isolated from mock-inoculated mice (M); IAV-infected, saline-treated mice (F+S); and IAV-infected, LPN-treated mice (F+L) at 6 d.p.i.; (C) total amounts of individual surfactant-related palmitoylated PC, PE, and phosphatidylglycerol (PG) species in ATII cells from individual mice in each treatment group at 6 d.p.i.; and (D) mean fold-changes in individual surfactant-related palmitoylated PC, PE, and PG species between ATII cells isolated from M, F+S, and F+L. n = 6/group. Heatmap colors indicate column z-scores (relative to row mean values) from lowest (blue) to highest (yellow). Thin horizontal dotted line indicates fold change = 0.5; solid horizontal line indicates fold change = 1; thick horizontal dotted line indicates fold change = 2. *P < 0.05 F+S versus M. †P < 0.05 F+L versus F+S. ◊P < 0.05 F+L versus M. Red symbol indicates significant decrease; black symbol indicates significant increase. CER = ceramide; FFA = free fatty acid; LPC = lysophosphatidylcholine; LPE = lysophosphatidylethanolamine; LPN = liponucleotide; MAG = monoacylglycerol; PI = phosphatidylinositol; SM = sphingomyelin; TAG = triacylglycerol.
