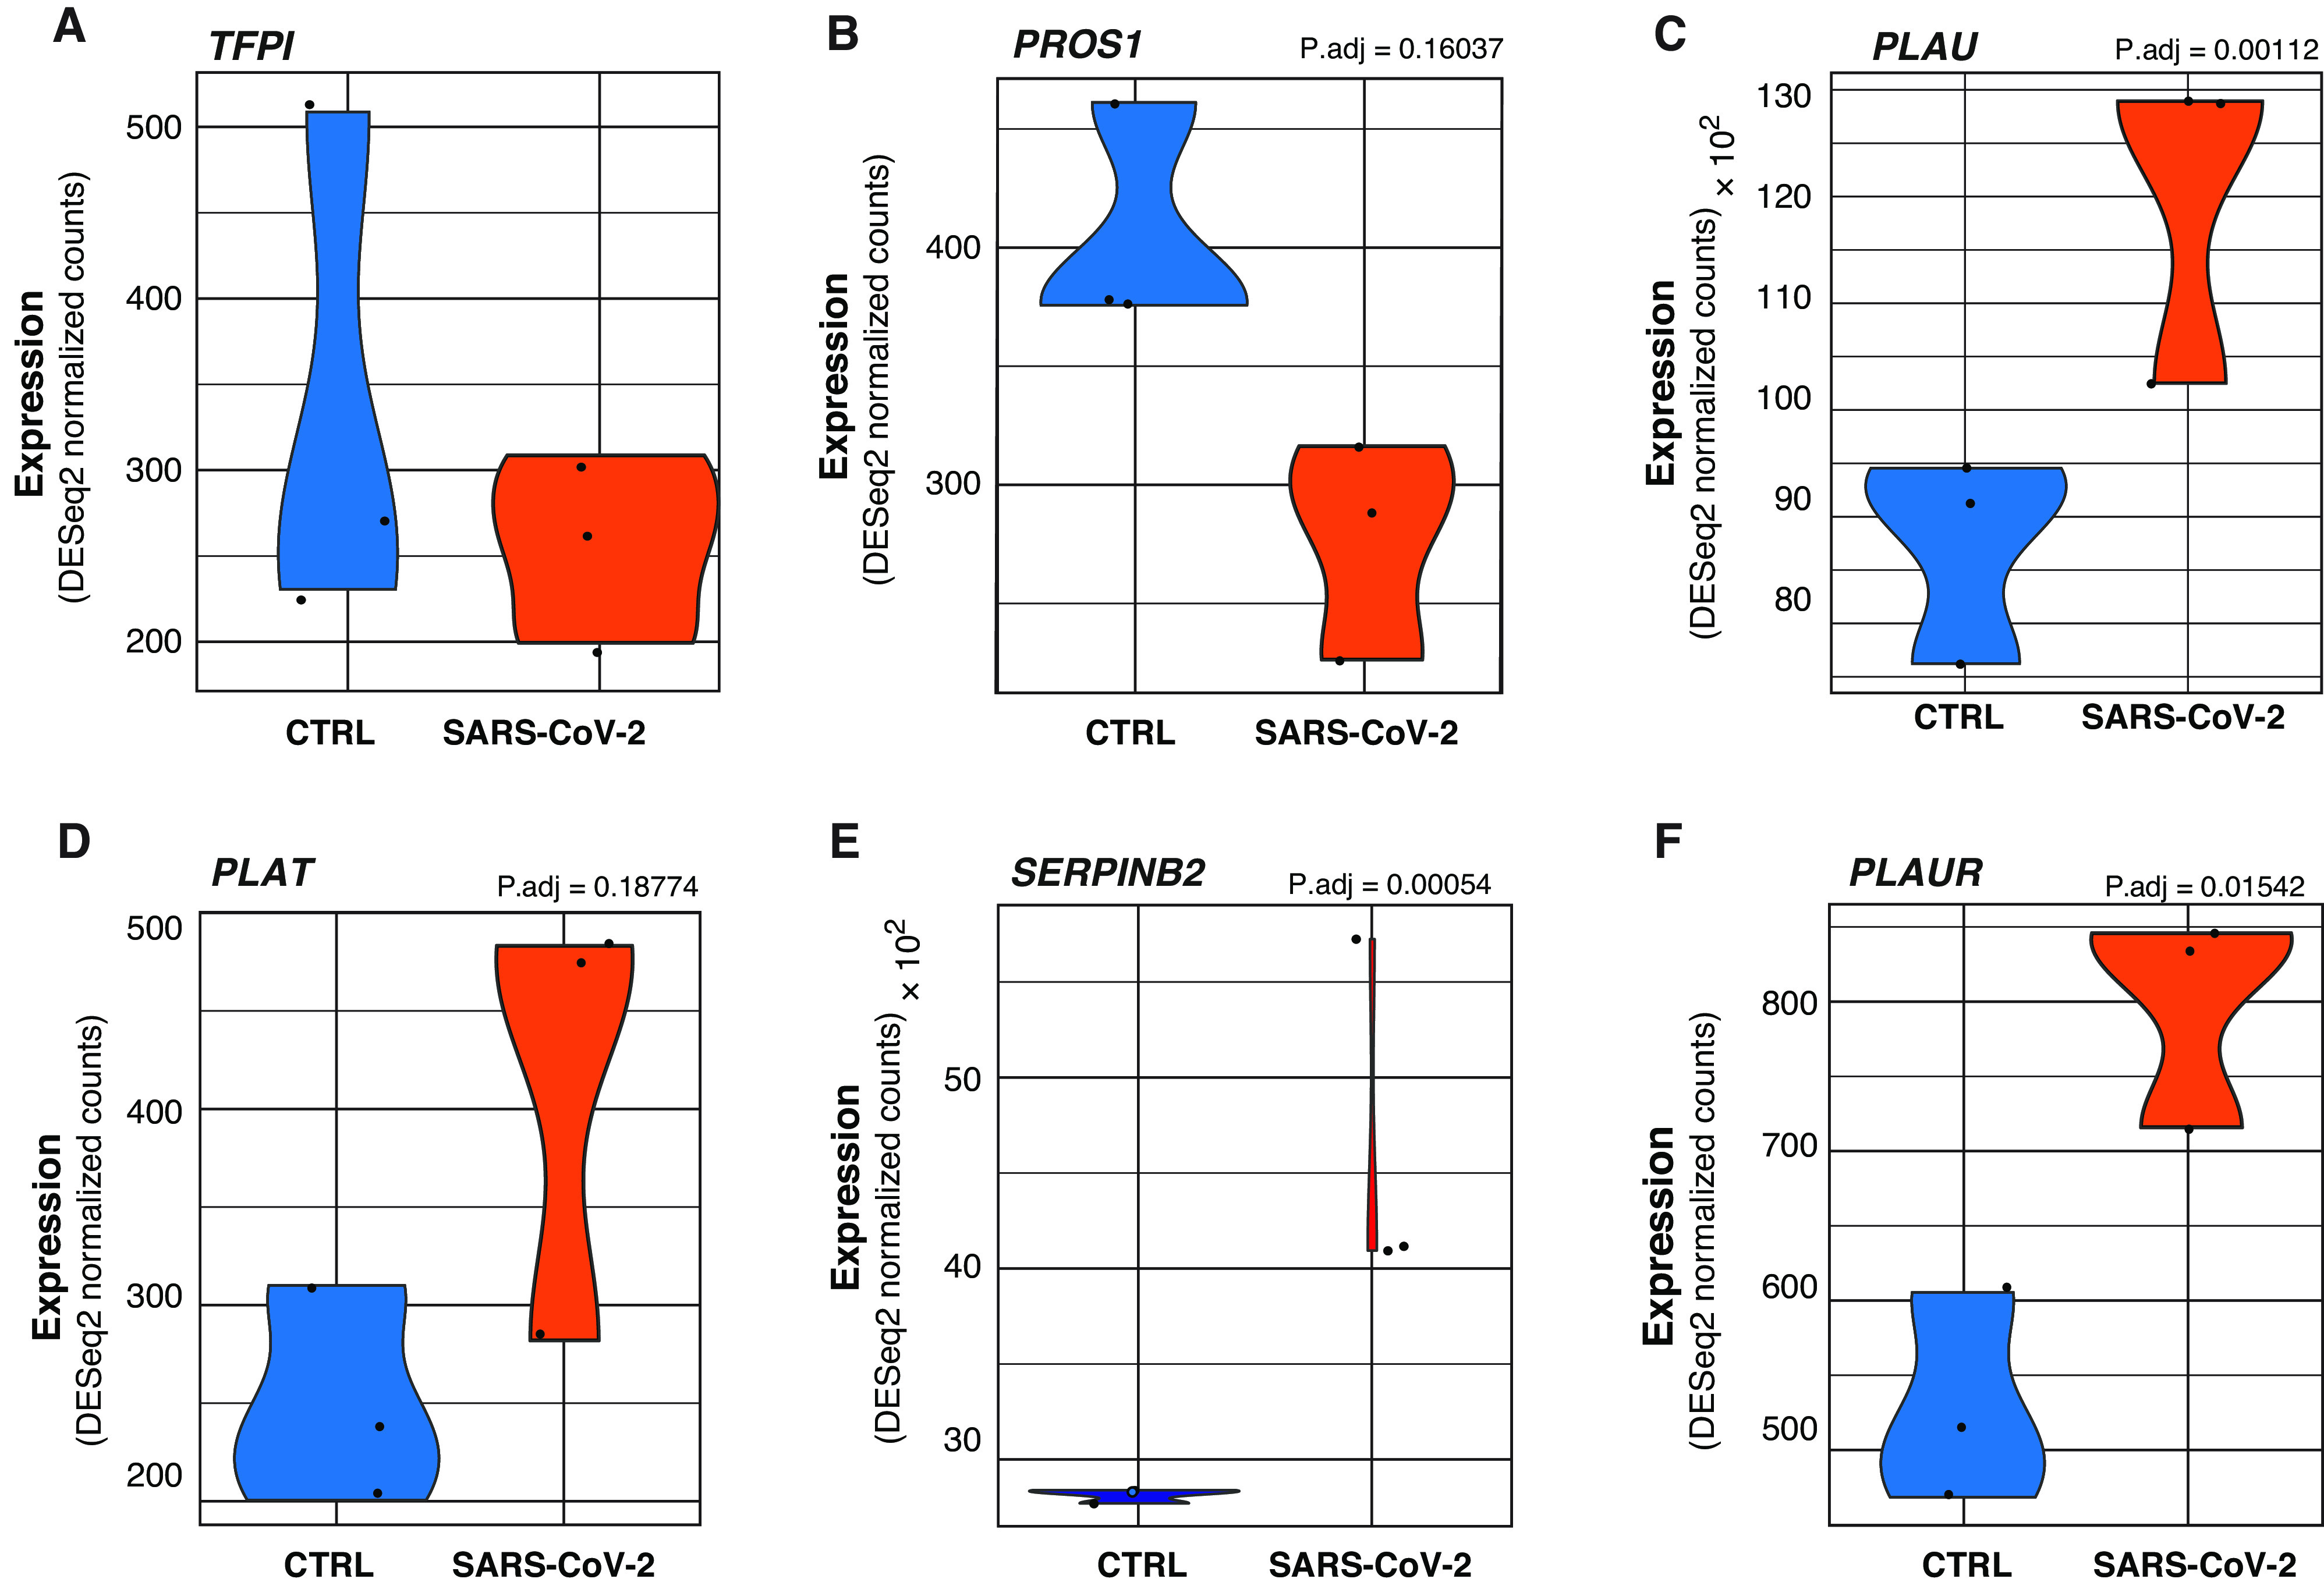
Figure 3.

(A–F) Violin plots depicting raw counts of reads mapping to negative regulators of the extrinsic coagulation cascade and regulators of the plasminogen activation system in mock-infected and SARS-CoV-2–infected NHBEs. Raw counts were normalized to library size in the DESeq2 software package. P.adj values displayed for significant differences were also calculated within DESeq2. Images were generated using GGPlot2 in the R studio environment.
