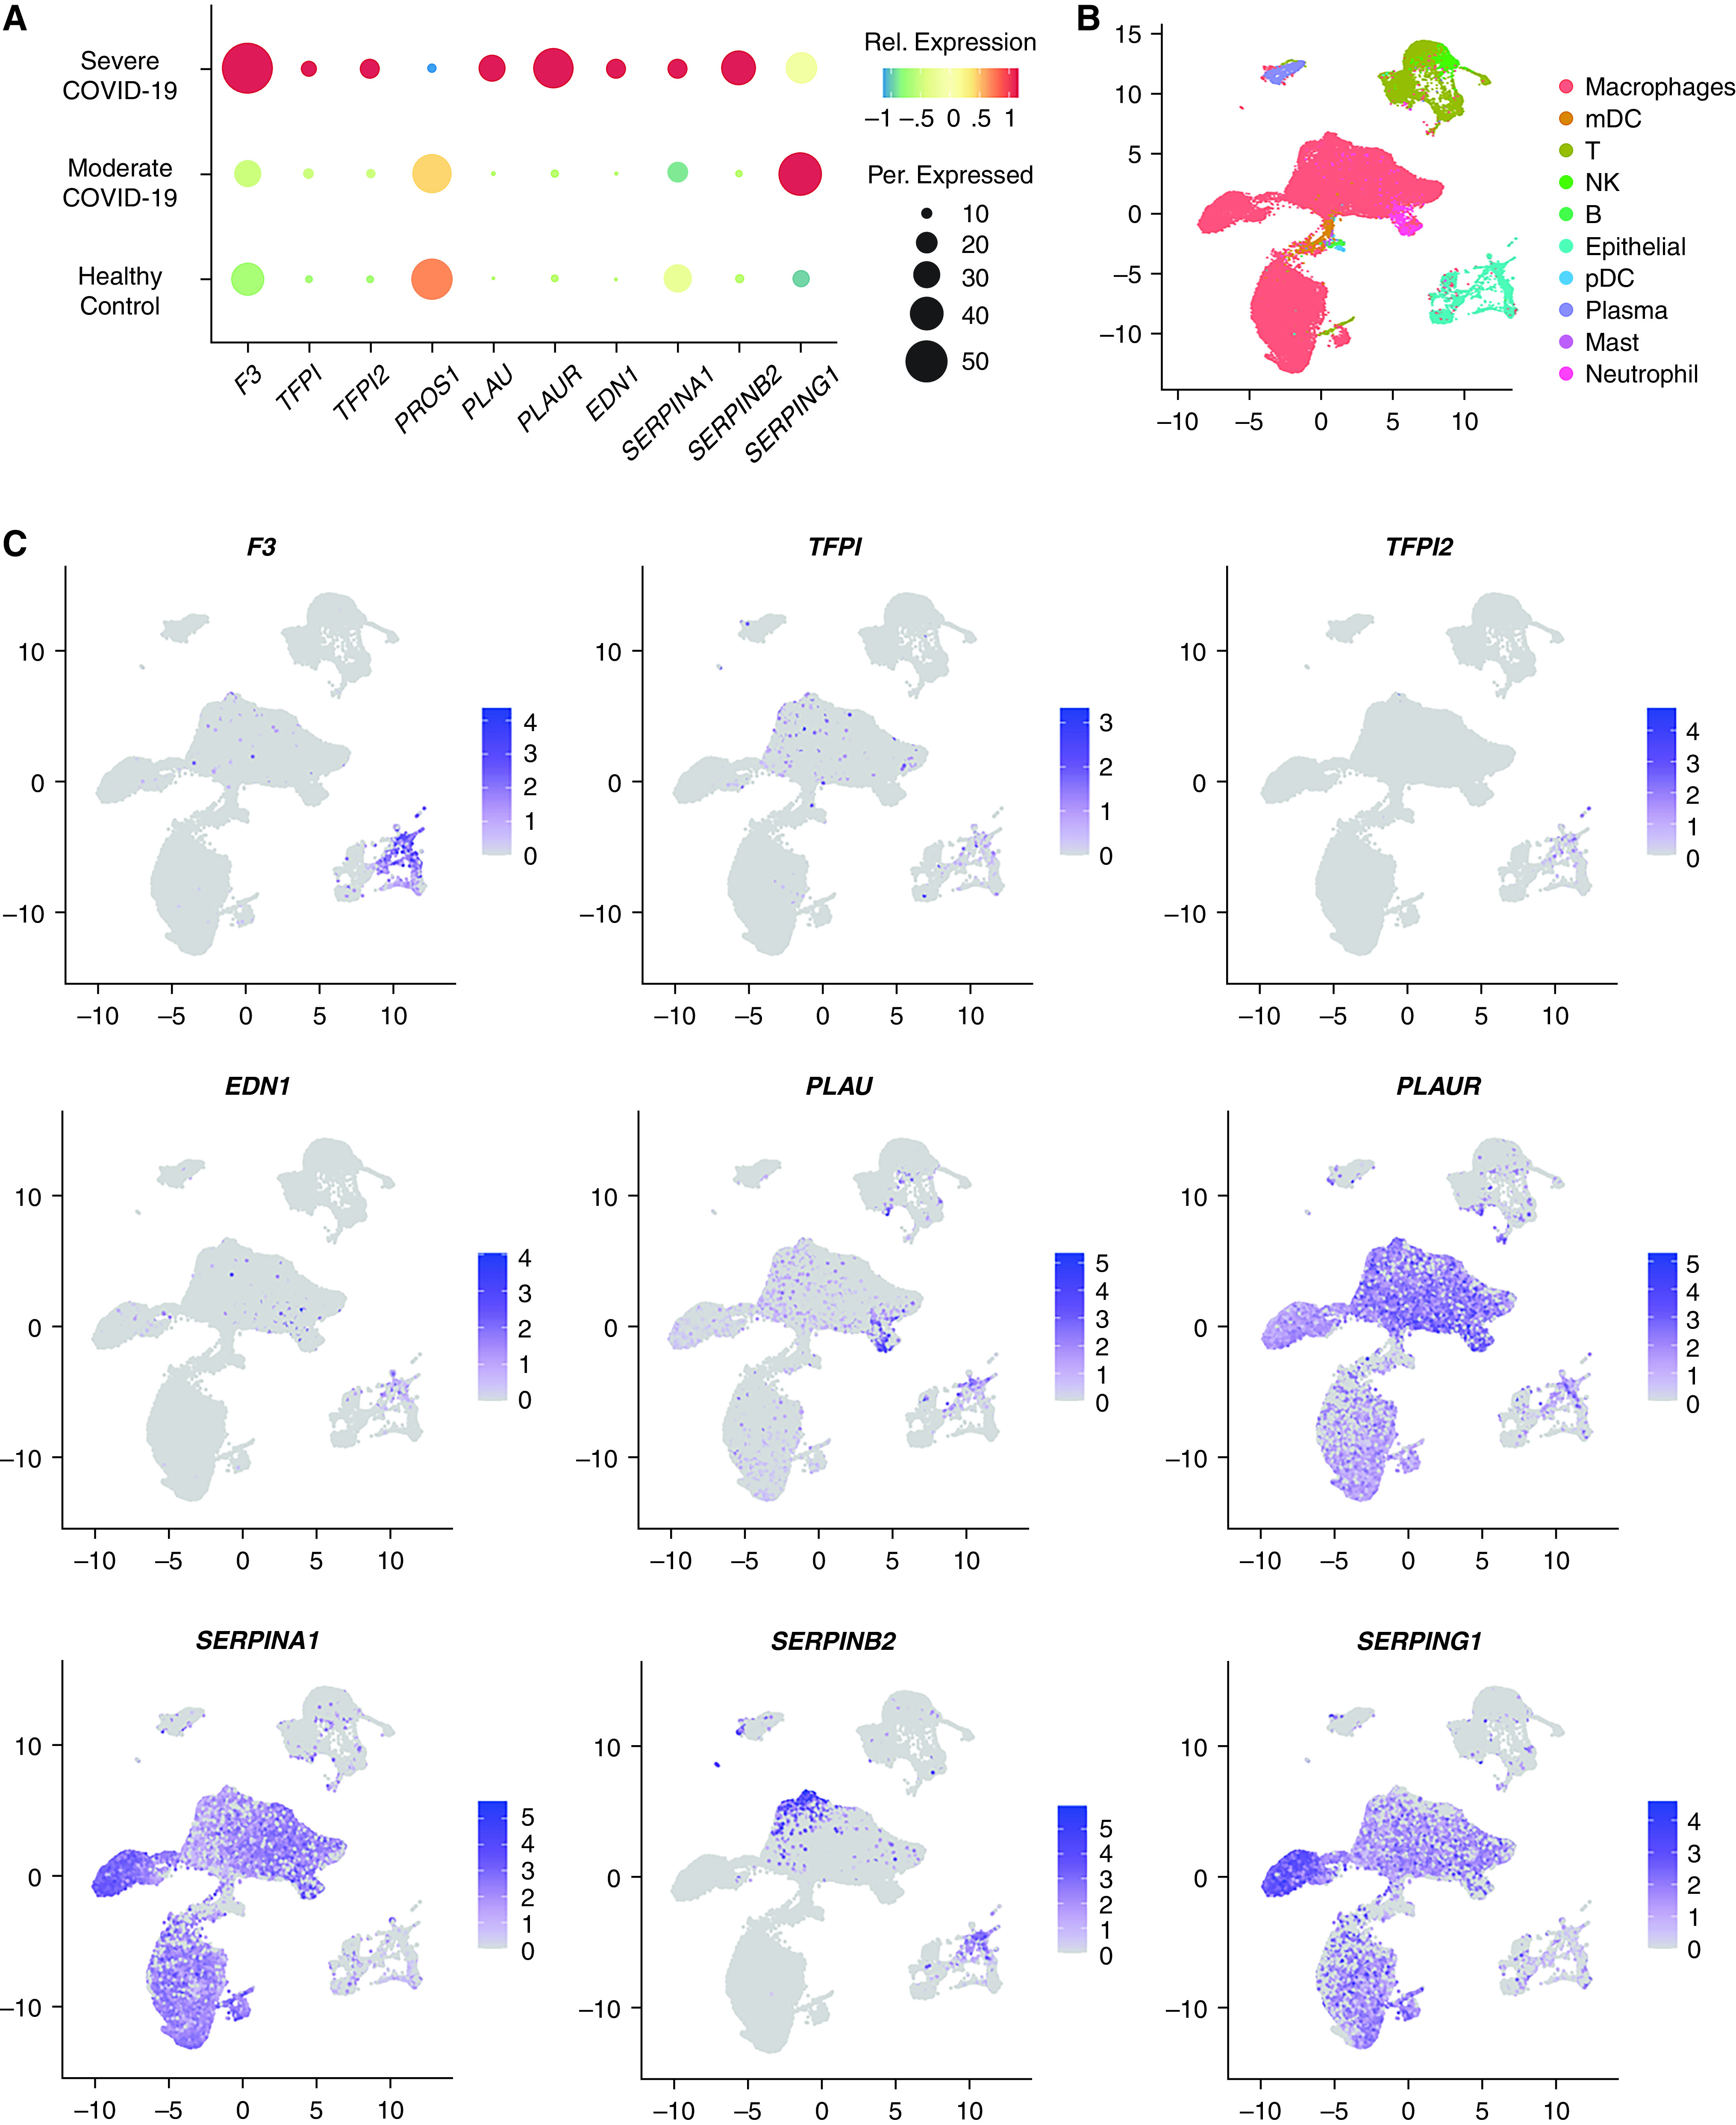
Figure 7.

Single-cell RNA-seq analysis of select extrinsic coagulation cascade and plasminogen regulating genes in all epithelial cells from BALF samples described in Liao and colleagues (42). See Liao and colleagues for a full description of the epithelial cell markers used for identification. (A) Seurat-generated dot plot summarizing a selection of genes regulating coagulation. Dot color is representative of the degree of relative (Rel.) expression for each gene, and dot size is representative of the percent of cells expressing each gene. (B) Seurat-generated uniform manifold approximation projection (UMAP) plot depicting cell clustering for all identified cell types in Liao and colleagues. See Liao and colleagues for a full description of settings used for the Seurat UMAP computation. (C) Seurat-generated feature plots showing the distribution and Rel. expression of mRNA for selected genes regulating coagulation in cells isolated from BALF.
