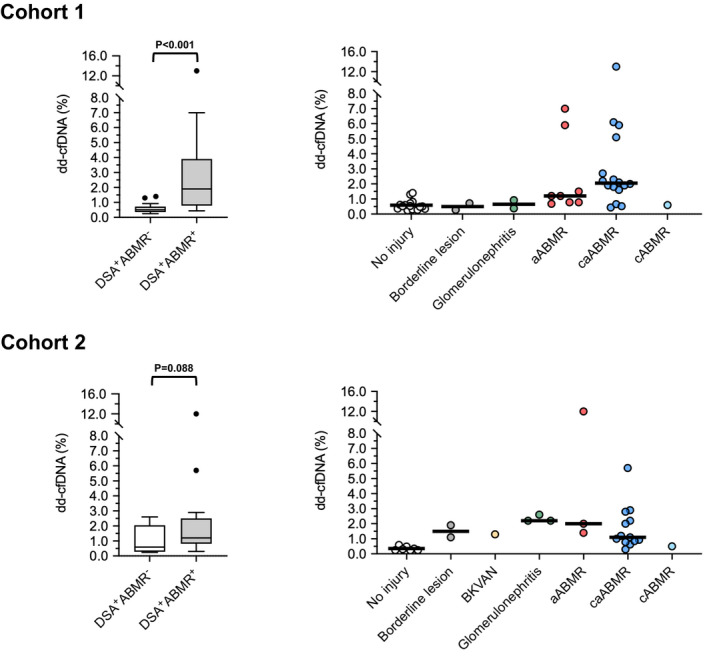
Figure 2.

Levels of dd‐cfDNA in cohorts 1 and 2, in relation to biopsy results. Box plots indicate median, IQR, and range. We used the unpaired Mann‐Whitney U test for group comparisons. ABMR, antibody‐mediated rejection; aABMR, active ABMR; BKVAN, BK virus nephropathy; BL, borderline lesion; caABMR, chronic active ABMR; cABMR, chronic ABMR (inactive).
