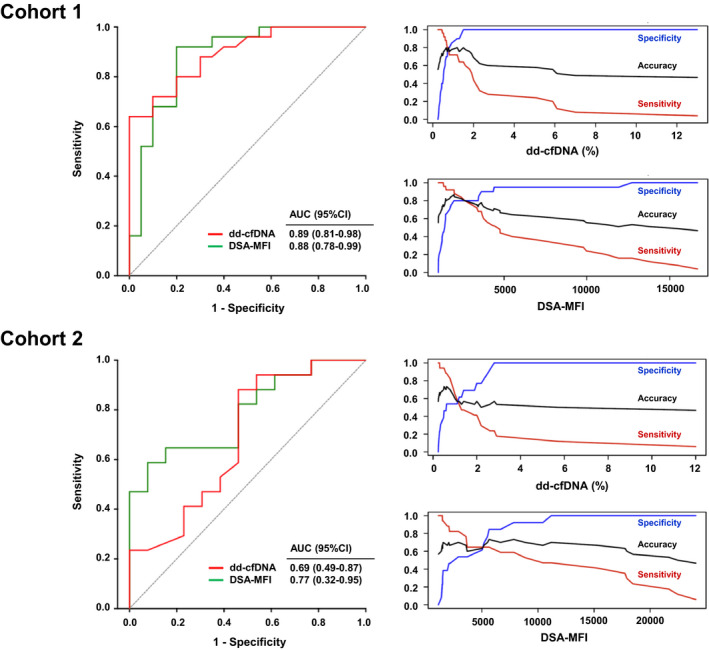
Figure 3.

Diagnostic accuracy of dd‐cfDNA and DSA‐MFI in relation to ABMR diagnosis. ROC analysis and characteristics of prediction in relation to continuous threshold values (accuracy, sensitivity and specificity) are shown for cohorts 1 and 2. AUC, area under the curve; CI, confidence interval.
