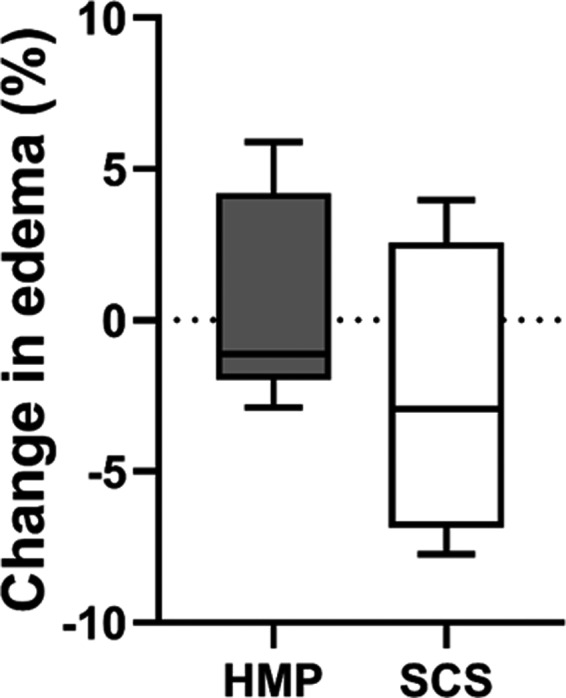
Figure 4.

Change in percentage of edema in HMP and SCS pancreases. Edema was measured as a percentage of interstitial space divided by the total area of tissue measured after H&E staining. The difference in percentage after and before either HMP or SCS is shown. HMP, hypothermic machine perfusion; SCS, static cold storage. Results are shown as box‐and‐whisker median ± interquartile range.
