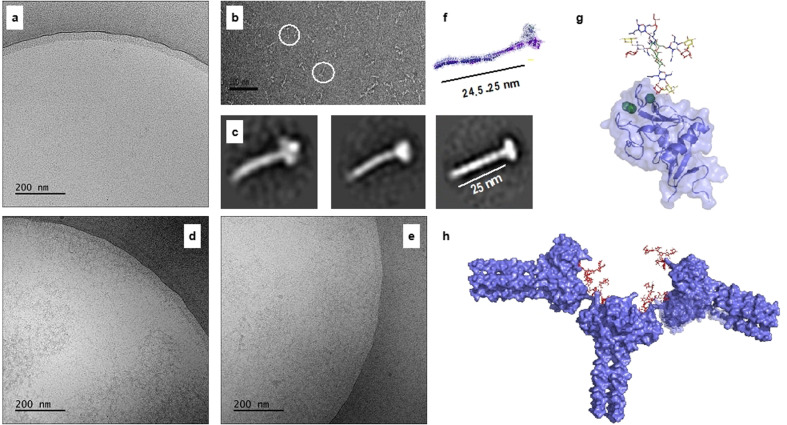
Figure 6.
Electron microscopy of DC‐SIGN interacting with multivalent glycans. Cryo‐TEM images at 50,000× magnification of apo DC‐SIGN (a) and in the presence of compound 1 (d) and 2 (e). (b) apo DC‐SIGN visualised by negative‐stain; the white circles mark the individual molecules. Scale bar is 100 nm. (c) three class‐averages resulting from 2D classification of extracted particles from negative‐stain 2D images and indicating the tetrameric oligomerization of DC‐SIGN (see SI). (f) 3D model of DC‐SIGN ECD assembled into tetramers. (g) 3D model of DC‐SIGN CRD showing the interaction with compound 1 as a single molecule. (h) 3D models of DC‐SIGN ECD (assembled into tetramers) showing the putative interaction with compound 1 and forming an inter‐connected network.

