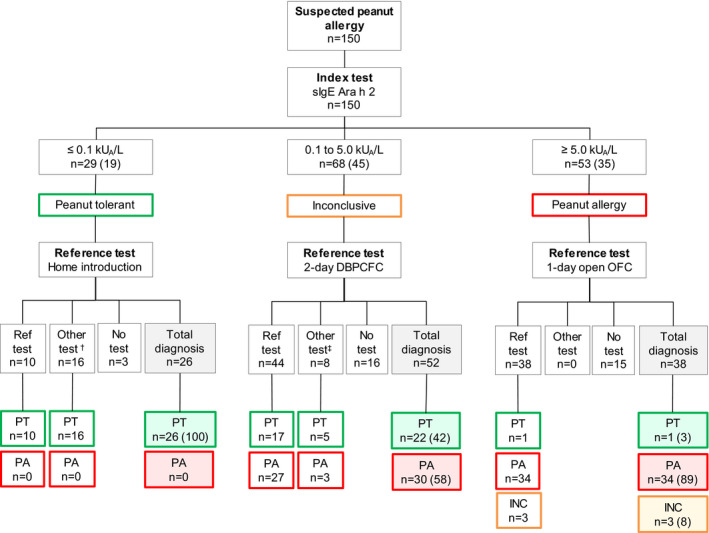
FIGURE 2.

Results of the diagnostic flow chart
Numbers between brackets are percentages.
DBPCFC, double‐blind placebo‐controlled food challenge; INC, inconclusive; OFC, oral food challenge; PA, peanut allergy; PT, peanut‐tolerant; Ref test = reference test; n=number.
† n = 9 supervised introduction, n = 3 DBPCFC and n = 4 open OFC (all n = 16 PT)
‡ n = 8 open OFC
