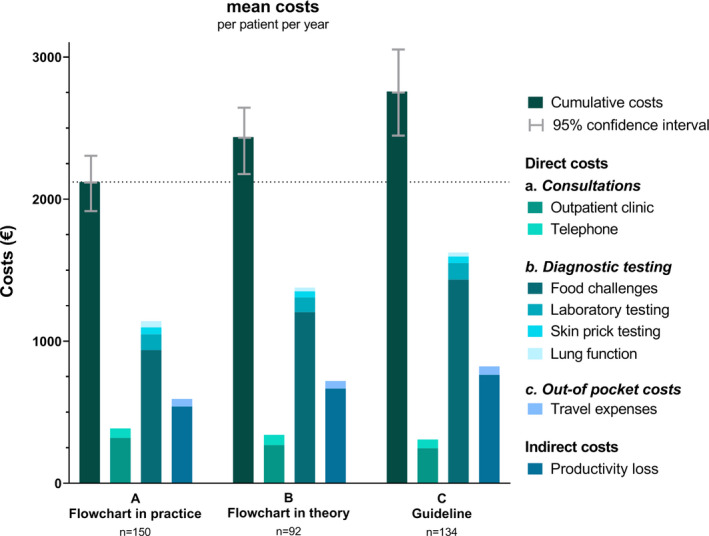
FIGURE 4.

Mean costs per patient per year for all included children (scenario A), for children diagnosed according to the diagnostic flow chart (scenario B) and a scenario analysis on the costs for children diagnosed according to the guideline (scenario C)
