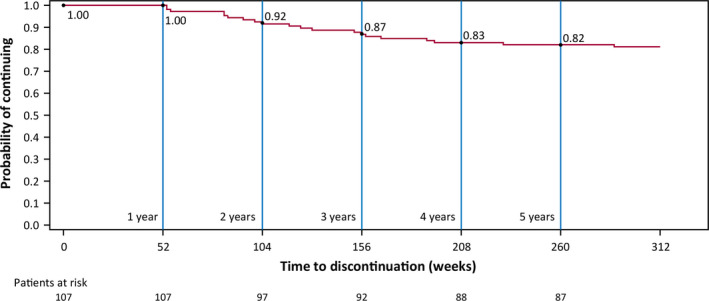
FIGURE 2.

Kaplan–Meier plot of continuation during the open‐label extension (OLE) in the patients who remained in the OLE at 12 months. Event = early discontinuation from OLE. Patients who completed the study and patients ongoing at the date of data cutoff are considered censored
