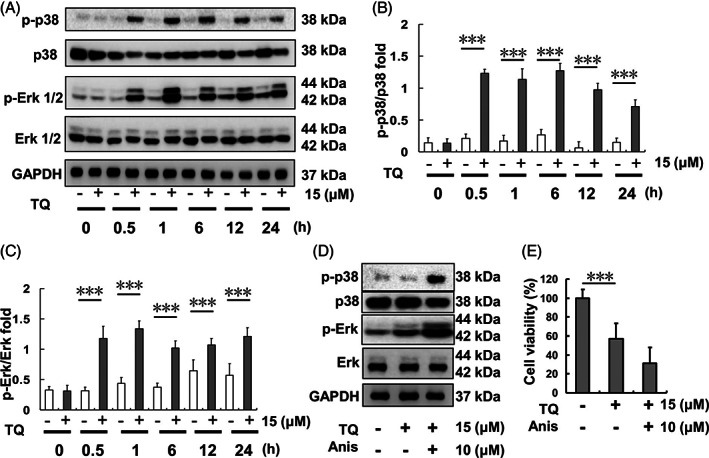
FIGURE 2.

Erk and p38 expression after different time courses of TQ (15 μM)‐exposure in SK‐Hep1 cells. (A) Erk and p38 protein expression levels. (B) p‐p38/p38 protein expression ratio after TQ exposure over different time courses. (C) p‐Erk/Erk protein expression ratio after TQ exposure over different time courses. (D) Erk and p38 protein expression levels upon TQ‐only treatment or TQ‐anisomycin (Anis) co‐treatment. (E) Cell viability of SK‐Hep1 cells after 24‐h TQ and anisomycin co‐treatment. (***p < .001). TQ, thymoquinone
